
(a)
Graph the supply curve.
(a)
Explanation of Solution
Given information:
The supply function of wheat:
In Equation (1), “QSW” is the quantity of wheat supplied, “PW” is the price of wheat per bushel, “PC” is the price of corn per bushel, and “PF” is the price of tractor fuel per gallon.
Price of corn (PC): $4
Price of fuel (PF): $2
Calculation:
The supply equation can be simplified by substituting the respective values in Equation (1). This is done because while calculating the change in supply due to the changes in the price of that good, all the other factors are considered constant.
The supply equation when other things remain the same is
Rearrange Equation (2) in terms of price of those goods to derive the invers supply equation.
Substitute the quantity as zero in Equation (3) to calculate the price of wheat (minimum willing price).
The minimum wiling price of wheat is $4. The slope indicates that increasing 4 units of quantity leads to increase the price by $1(increasing 1 unit increases the price by $0.25).
By using these information, the supply curve of wheat is illustrated in Figure 1 as follows:
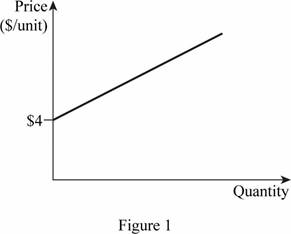
In Figure 1, the vertical axis measures the price of wheat and the horizontal axis measures the quantity of wheat. The upward sloping curve “S” is the supply curve of wheat.
Supply curve: A supply curve is a graph which shows the quantities of commodity that the producers are willing to sell at different price levels.
(b)
The calculation of quantity supply.
(b)
Explanation of Solution
At price $4, the quantity supply of wheat (QSW ) is calculated by substituting the respective values in Equation (2) as follows:
The quantity supplied of wheat at price $4 is 0 unit.
At price $8, the quantity supply of wheat (QSW ) is calculated by substituting the respective values in Equation (2) as follows:
The quantity of wheat supplied at price $8 is 16 units.
(c)
The changes in the supply of wheat.
(c)
Explanation of Solution
Given information:
Price of corn (PC) is $6.
Calculation:
The supply equation can be simplified by substituting the respective values in Equation (1). This is done because while calculating the change in supply due to the changes in the price of that good, all the other factors are considered constant.
The new supply equation when other things remain the same is
Rearrange Equation (4) in terms of price of those goods to derive the invers supply equation as follows:
Substitute the quantity as zero in Equation (5) to calculate the price of wheat (minimum willing price).
The price of wheat is $5. The slope indicates that increasing 4 units of quantity leads to increase the price by $1(increasing 1 unit increases the price by $0.25).
By using this information, the change in supply curve of wheat is shown in Figure 2 as follows:
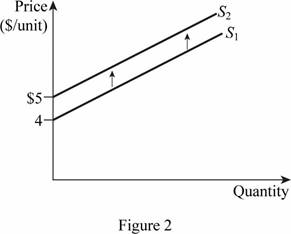
In Figure 2, the vertical axis measures the price of wheat and the horizontal axis measures the quantity of wheat demanded. S1 is the initial supply curve of the wheat. The increase in quantity supply of wheat shifts the supply curve from S1 to S2. It leads to increase the choke price from $4 to $5.
Supply curve: A supply curve is a graph which shows the quantities of commodity that the producers are willing to sell at different price levels.
(d)
The changes in the supply of wheat.
(d)
Explanation of Solution
Given information:
The price of fuel (PF) is $1 and the price of corn remains at $4.
Calculation:
The supply equation can be simplified by substituting the respective values in Equation (1). This is done because while calculating the change in supply due to the changes in the price of that good, all the other factors are considered constant.
The new supply equation when other things remain the same is
Rearrange Equation (6) in terms of price of those goods to derive the invers supply equation.
Substitute the quantity as zero in Equation (7) to calculate the price of wheat (minimum willing price).
The price of wheat is $3.75. The slope indicates that increasing 4 units of quantity leads to increase the price by $1(increasing 1 unit increases the price by $0.25)..
By using this information, the change in the supply curve of wheat is shown below Figure 3:
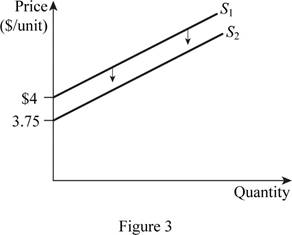
In Figure 3, the vertical axis measures the price of wheat and the horizontal axis measures the quantity of wheat demanded. S1 is the initial supply curve of the wheat. The reduction in the quantity supply of wheat shifts the supply curve from S1 to S2. It leads to decrease the choke price from $4 to $3.75.
Supply curve: A supply curve is a graph which shows the quantities of commodity that the producers are willing to sell at different price levels.
Want to see more full solutions like this?
Chapter 2 Solutions
Microeconomics (Instructor's)


 Principles of Economics (12th Edition)EconomicsISBN:9780134078779Author:Karl E. Case, Ray C. Fair, Sharon E. OsterPublisher:PEARSON
 Engineering Economy (17th Edition)EconomicsISBN:9780134870069Author:William G. Sullivan, Elin M. Wicks, C. Patrick KoellingPublisher:PEARSON
 Principles of Economics (MindTap Course List)EconomicsISBN:9781305585126Author:N. Gregory MankiwPublisher:Cengage Learning
 Managerial Economics: A Problem Solving ApproachEconomicsISBN:9781337106665Author:Luke M. Froeb, Brian T. McCann, Michael R. Ward, Mike ShorPublisher:Cengage Learning
 Managerial Economics & Business Strategy (Mcgraw-...EconomicsISBN:9781259290619Author:Michael Baye, Jeff PrincePublisher:McGraw-Hill Education