ELEM. STATISTICS TEXT W/ MANUAL+CONNECT
1st Edition
ISBN: 9781260722031
Author: Navidi
Publisher: McGraw-Hill Publishing Co.
bartleby

Videos

Textbook Question
Book Icon
Chapter 2, Problem 6RE

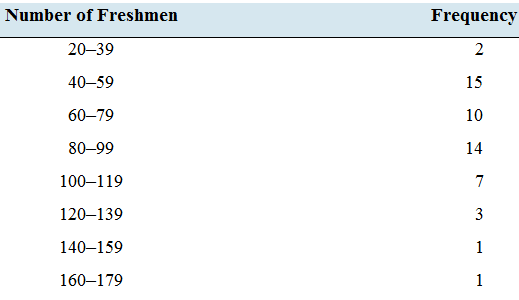
House freshmen: Newly elected members of the U.S. House of Representatives are referred to as “freshmen.” The following frequency distribution presents the number of freshmen elected in each of the past 53 elections, from 1912 to 2016.

Chapter 2, Problem 6RE, House freshmen: Newly elected members of the U.S. House of Representatives are referred to as

  1. How many classes are there?
  2. What is the class width?
  3. What are the class limits?
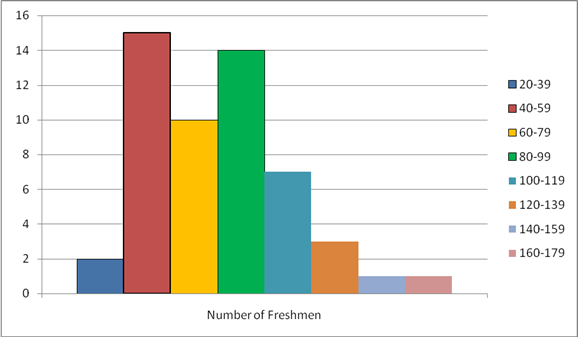
  4. Construct a frequency histogram.
  5. Construct a relative frequency distribution.
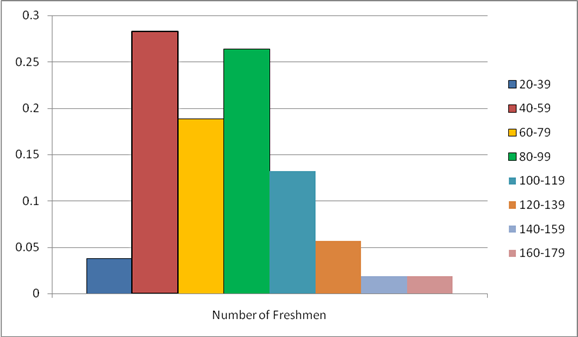
  6. Construct a relative frequency histogram.
  7. In what percentage of elections were loo or more freshmen elected?
  8. In what percentage of elections were fewer than 60 freshmen elected?

a.

Expert Solution
Check Mark
To determine

To find:Number of classes.

Answer to Problem 6RE

The number of classes is 8.

Explanation of Solution

Given information:The following frequency distribution presents the numberof freshmen elected in each of the past 53 elections from 1912 to 2016.

    Number of FreshmenFrequency
    20-392
    40-5915
    60-7910
    80-9914
    100-1197
    120-1393
    140-1591
    160-1791

Calculation:

The classes from the given table are 20-39, 40-59, 60-79, 80-99, 100-119, 120-139, 140-159 and 160-179.

There are eight classes are there.

Hence, the number of classes is 8.

b.

Expert Solution
Check Mark
To determine

To find: The class width.

Answer to Problem 6RE

The class width is 19.

Explanation of Solution

Given information: The following frequency distribution presents the number of freshmen elected in each of the past 53 elections from 1912 to 2016.

    Number of FreshmenFrequency
    20-392
    40-5915
    60-7910
    80-9914
    100-1197
    120-1393
    140-1591
    160-1791

Formula used: class width=largest data valuesmallest data valueNumber of classes

Calculation:

From the given table, the largest value is 179 and the smallest value is 20.

The number of classes is 8.

Then the class width is given by

  class width=largest data valuesmallest data valueNumber of classesclass width=179208=1598=19.87519

Hence, the class width is 19.

c.

Expert Solution
Check Mark
To determine

To find: The class limits.

Answer to Problem 6RE

The lower class limits are 20, 40, 60, 80, 100, 120, 140 and 160.

The upper class limits are 39, 59, 79, 99, 119, 139, 159 and 179.

Explanation of Solution

Given information: The following frequency distribution presents the number of freshmen elected in each of the past 53 elections from 1912 to 2016.

    Number of FreshmenFrequency
    20-392
    40-5915
    60-7910
    80-9914
    100-1197
    120-1393
    140-1591
    160-1791

Definition used:

The lower class limits of a class are the smallest value that can appear in that class.

The upper class limits of a class are the largest value that can appear in that class.

Calculation:

From the given table we can say that

The lower class limits are 20, 40, 60, 80, 100, 120, 140 and 160.

The upper class limits are 39,59, 79, 99, 119, 139, 159 and 179.

d.

Expert Solution
Check Mark
To determine

To construct: A frequency histogram.

Explanation of Solution

Given information: The following frequency distribution presents the number of freshmen elected in each of the past 53 elections from 1912 to 2016.

    Number of FreshmenFrequency
    20-392
    40-5915
    60-7910
    80-9914
    100-1197
    120-1393
    140-1591
    160-1791

Definition used:

Histogram based on frequency is called frequency histogram.

Solution:

From the given table, the frequency histogram is given by

  ELEM. STATISTICS TEXT W/ MANUAL+CONNECT, Chapter 2, Problem 6RE , additional homework tip  1

e.

Expert Solution
Check Mark
To determine

To construct: The relative frequency distribution.

Explanation of Solution

Given information: The following frequency distribution presents the number of freshmen elected in each of the past 53 elections from 1912 to 2016.

    Number of FreshmenFrequency
    20-392
    40-5915
    60-7910
    80-9914
    100-1197
    120-1393
    140-1591
    160-1791

Formula used:  Relative frequency=Frequency

   Relative frequency=Frequency Sum of all Frequency

Calculation:

From the given table,

The sum of all frequency is 2+15+10+14+7+3+1+1=53

The table of relative frequency is given by

    Number of FreshmenFrequencyRelative Frequency
    20-392253=0.0377
    40-59151553=0.2830
    60-79101053=0.1887
    80-99141453=0.2642
    100-1197753=0.1321
    120-1393353=0.0566
    140-1591153=0.0189
    160-1791153=0.0189

f.

Expert Solution
Check Mark
To determine

To construct: A relative frequency histogram.

Explanation of Solution

Given information: The following frequency distribution presents the number of freshmen elected in each of the past 53 elections from 1912 to 2016.

    Number of FreshmenFrequency
    20-392
    40-5915
    60-7910
    80-9914
    100-1197
    120-1393
    140-1591
    160-1791

Definition used:

Histogram based on relative frequency is called relative frequency histogram.

Solution:

    Number of FreshmenFrequencyRelative Frequency
    20-3920.0377
    40-59150.2830
    60-79100.1887
    80-99140.2642
    100-11970.1321
    120-13930.0566
    140-15910.0189
    160-17910.0189

From the above table, the relative frequency histogram is given by

  ELEM. STATISTICS TEXT W/ MANUAL+CONNECT, Chapter 2, Problem 6RE , additional homework tip  2

g.

Expert Solution
Check Mark
To determine

To find: The percentage of elections was 100 or more freshmen elected.

Answer to Problem 6RE

The percentage of elections was 100 or more freshmen elected is 22.6% .

Explanation of Solution

Given information: The following frequency distribution presents the number of freshmen elected in each of the past 53 elections from 1912 to 2016.

    Number of FreshmenFrequency
    20-392
    40-5915
    60-7910
    80-9914
    100-1197
    120-1393
    140-1591
    160-1791

Definition used:

Percentage for a frequency is given by

   Percentage=Frequency Sum of all Frequency×100%

Calculation:

From the given table we can say that

The frequency for 100 or more freshmen elected is 7, 3, 1 and 1.

The sum of all frequencies of 100 or more freshmen were elected is 7+3+1+1=12

The sum of all frequency is 53.

Hence, the percentage is given by

   Percentage=Frequency Sum of all Frequency×100%=1253×100%=0.226×100%=22.6%

Hence, the percentage of elections was 100 or more freshmen electedis 22.6% .

h.

Expert Solution
Check Mark
To determine

To find: The percentage of elections was fewer than 60 freshmen elected.

Answer to Problem 6RE

Thepercentage of elections was fewer than 60 freshmen elected is 32% .

Explanation of Solution

Given information: The following frequency distribution presents the number of freshmen elected in each of the past 53 elections from 1912 to 2016.

    Number of FreshmenFrequency
    20-392
    40-5915
    60-7910
    80-9914
    100-1197
    120-1393
    140-1591
    160-1791

Definition used:

Percentage for a frequency is given by

   Percentage=Frequency Sum of all Frequency×100%

Calculation:

From the given table we can say that

The frequency for fewer than 60 freshmen elected is 2 and 15.

The sum of all frequencies of fewer than 60 freshmen were elected is 2+15=17

The sum of all frequency is 53.

Hence, the percentage is given by

   Percentage=Frequency Sum of all Frequency×100%=1753×100%=0.32×100%=32%

Hence, the percentage of elections was fewer than 60 freshmen elected is 32% .

Want to see more full solutions like this?

Subscribe now to access step-by-step solutions to millions of textbook problems written by subject matter experts!

Chapter 2 Solutions

ELEM. STATISTICS TEXT W/ MANUAL+CONNECT

Ch. 2.1 - Following is a pie chart that presents the...Ch. 2.1 - Government spending: The following pie chart...Ch. 2.1 - U.S. population: The following side-by-side bar...Ch. 2.1 - Super Bowl: The following side-by-side bar graph...Ch. 2.1 - Smartphone sales: The following frequency...Ch. 2.1 - Popular video games: The following frequency...Ch. 2.1 - More smartphones: Using the data in Exercise 19:...Ch. 2.1 - More video games: Using the data in Exercise 20:...Ch. 2.1 - Hospital admissions: The following frequency...Ch. 2.1 - World population: Following are the populations of...Ch. 2.1 - Ages of video garners: The Nielsen Company...Ch. 2.1 - How secure is your job? In a survey, employed...Ch. 2.1 - Back up your data: In a survey commissioned by the...Ch. 2.1 - Education levels: The following frequency...Ch. 2.1 - Twitter followers: The following frequency...Ch. 2.1 - Music sales: The following frequency distribution...Ch. 2.1 - Keeping up with the Kardashians: The following...Ch. 2.1 - Bought a new car lately? The following table...Ch. 2.1 - Bought a new- truck lately? The following table...Ch. 2.1 - Happy Halloween: The following table presents...Ch. 2.1 - Native languages: The following frequency...Ch. 2.1 - Proportion of females: Following are the...Ch. 2.2 - Prob. 5ECh. 2.2 - In Exercises 5—8, fill in each blank with the...Ch. 2.2 - In Exercises 5—8, fill in each blank with the...Ch. 2.2 - In Exercises 5—8, fill in each blank with the...Ch. 2.2 - In Exercises 9—12, determine whether the...Ch. 2.2 - In Exercises 9—12, determine whether the...Ch. 2.2 - In Exercises 9—12, determine whether the...Ch. 2.2 - In Exercises 9—12, determine whether the...Ch. 2.2 - In Exercises 13—16, classify the histogram as...Ch. 2.2 - In Exercises 13—16, classify the histogram as...Ch. 2.2 - In Exercises 13—16, classify the histogram as...Ch. 2.2 - In Exercises 13—16, classify the histogram as...Ch. 2.2 - In Exercises 17 and 18, classify the histogram as...Ch. 2.2 - In Exercises 17 and 18, classify the histogram as...Ch. 2.2 - Student heights: The following frequency histogram...Ch. 2.2 - Trained rats: Forty rats were trained to run a...Ch. 2.2 - Cholesterol: The following histogram shows the...Ch. 2.2 - Blood pressure: The following histogram shows the...Ch. 2.2 - Olympic athletes: The following frequency...Ch. 2.2 - Hows the weather? The following relative frequency...Ch. 2.2 - Skewed which way? For which of the following data...Ch. 2.2 - Skewed which way? For which of the following data...Ch. 2.2 - Batting average: The following frequency...Ch. 2.2 - Batting average: The following frequency...Ch. 2.2 - Time spent playing video games: A sample of 200...Ch. 2.2 - Murder, she wrote: The following frequency...Ch. 2.2 - BMW prices: The following table presents the...Ch. 2.2 - Geysers: The geyser Old Faithful in Yellowstone...Ch. 2.2 - Hail to the chief: There have been 58 presidential...Ch. 2.2 - Internet radio: The following table presents the...Ch. 2.2 - Brothers and sisters: Thirty students in a...Ch. 2.2 - Cough, cough: The following table presents the...Ch. 2.2 - Prob. 37ECh. 2.2 - Prob. 38ECh. 2.2 - Prob. 39ECh. 2.2 - Prob. 40ECh. 2.2 - Frequency polygon: Using the data in Exercise 29:...Ch. 2.2 - Prob. 42ECh. 2.2 - Ogive: Using the data in Exercise 27: Compute the...Ch. 2.2 - Ogive: Using the data in Exercise 28: Compute the...Ch. 2.2 - Ogive: Using the data in Exercise 29: Compute the...Ch. 2.2 - Prob. 46ECh. 2.2 - Prob. 47ECh. 2.2 - Prob. 48ECh. 2.2 - Prob. 49ECh. 2.2 - Prob. 50ECh. 2.2 - Prob. 51ECh. 2.2 - Prob. 52ECh. 2.2 - Frequencies and relative frequencies: The...Ch. 2.3 - In Exercises 3—6, fill in each blank with the...Ch. 2.3 - In Exercises 3—6, fill in each blank with the...Ch. 2.3 - In Exercises 3—6, fill in each blank with the...Ch. 2.3 - In Exercises 3—6, fill in each blank with the...Ch. 2.3 - Prob. 7ECh. 2.3 - In Exercises 7—10, determine whether the...Ch. 2.3 - In Exercises 7—10, determine whether the...Ch. 2.3 - In Exercises 7—10, determine whether the...Ch. 2.3 - Construct a stem-and-leaf plot for the following...Ch. 2.3 - Construct a stem-and-leaf plot for the following...Ch. 2.3 - List the data in the following stem-and-leaf plot....Ch. 2.3 - List the data in the following stein-and-leaf...Ch. 2.3 - Construct a dotplot for the data in Exercise 11.Ch. 2.3 - Prob. 16ECh. 2.3 - BMW prices: The following table presents the...Ch. 2.3 - Hows the weather? The following table presents the...Ch. 2.3 - Air pollution: The following table presents...Ch. 2.3 - Technology salaries: The following table presents...Ch. 2.3 - Tennis and golf: Following are the ages of the...Ch. 2.3 - Pass the popcorn: Following are the running times...Ch. 2.3 - More weather: Construct a dotplot for the data in...Ch. 2.3 - Prob. 24ECh. 2.3 - Looking for a job: The following table presents...Ch. 2.3 - Prob. 26ECh. 2.3 - Military spending: The following table presents...Ch. 2.3 - Prob. 28ECh. 2.3 - Dining out: The following time-series plot...Ch. 2.3 - Prob. 30ECh. 2.3 - Prob. 31ECh. 2.3 - More gold: The following time series plot presents...Ch. 2.3 - Prob. 33ECh. 2.3 - Prob. 34ECh. 2.3 - Vote: The following time-series plot presents the...Ch. 2.3 - Arctic ice sheet: The following table presents the...Ch. 2.3 - Prob. 37ECh. 2.4 - In Exercises 3 and 4, fill in each blank with the...Ch. 2.4 - In Exercises 3 and 4, fill in each blank with the...Ch. 2.4 - CD sales decline: Sales of CDs have been declining...Ch. 2.4 - Music sales: The following time-series plot and...Ch. 2.4 - Stock market prices: The Dow Jones Industrial...Ch. 2.4 - Save your money: In 2007, U.S. residents saved...Ch. 2.4 - Ill take mine with mustard: The following bar...Ch. 2.4 - Stream or download? The following bar graph...Ch. 2.4 - Female senators: Of the 100 members of the United...Ch. 2.4 - Age at marriage: Data compiled by the U.S. Census...Ch. 2.4 - College degrees: Both of the following time-series...Ch. 2.4 - Food expenditures: Both of the following...Ch. 2.4 - Prob. 15ECh. 2 - Following is the list of letter grades for...Ch. 2 - Prob. 2CQCh. 2 - Construct a frequency bar graph for the data in...Ch. 2 - Prob. 4CQCh. 2 - Prob. 5CQCh. 2 - Prob. 6CQCh. 2 - Prob. 7CQCh. 2 - Prob. 8CQCh. 2 - Prob. 9CQCh. 2 - Prob. 10CQCh. 2 - Following are the prices (in dollars) for a sample...Ch. 2 - Prob. 12CQCh. 2 - Prob. 13CQCh. 2 - Prob. 14CQCh. 2 - Prob. 15CQCh. 2 - Trust your doctor: The General Social Survey...Ch. 2 - Internet browsers: The following relative...Ch. 2 - Prob. 3RECh. 2 - Prob. 4RECh. 2 - Prob. 5RECh. 2 - House freshmen: Newly elected members of the U.S....Ch. 2 - More freshmen: For the data in Exercise 6:...Ch. 2 - Royalty: Following are the ages at death for all...Ch. 2 - Prob. 9RECh. 2 - Prob. 10RECh. 2 - Prob. 11RECh. 2 - Prob. 12RECh. 2 - Prob. 13RECh. 2 - Prob. 14RECh. 2 - Prob. 15RECh. 2 - Explain why the frequency bar graph and the...Ch. 2 - Prob. 2WAICh. 2 - Prob. 3WAICh. 2 - Prob. 4WAICh. 2 - Prob. 5WAICh. 2 - In the chapter introduction, we presented gas...Ch. 2 - In the chapter introduction, we presented gas...Ch. 2 - In the chapter introduction, we presented gas...Ch. 2 - Prob. 4CSCh. 2 - In the chapter introduction, we presented gas...Ch. 2 - Prob. 6CSCh. 2 - In the chapter introduction, we presented gas...Ch. 2 - Prob. 8CSCh. 2 - In the chapter introduction, we presented gas...
Knowledge Booster
Background pattern image
Statistics
Learn more about
Need a deep-dive on the concept behind this application? Look no further. Learn more about this topic, statistics and related others by exploring similar questions and additional content below.
Recommended textbooks for you
Text book image
Glencoe Algebra 1, Student Edition, 9780079039897...
Algebra
ISBN:9780079039897
Author:Carter
Publisher:McGraw Hill
How to make Frequency Distribution Table / Tally Marks and Frequency Distribution Table; Author: Reenu Math;https://www.youtube.com/watch?v=i_A6RiE8tLE;License: Standard YouTube License, CC-BY
Frequency distribution table in statistics; Author: Math and Science;https://www.youtube.com/watch?v=T7KYO76DoOE;License: Standard YouTube License, CC-BY
Frequency Distribution Table for Grouped/Continuous data | Math Dot Com; Author: Maths dotcom;https://www.youtube.com/watch?v=ErnccbXQOPY;License: Standard Youtube License