
EP BASIC BUS.STATS-ACCESS (18 WEEKS)
14th Edition
ISBN: 9780135989005
Author: BERENSON
Publisher: PEARSON CO
expand_more
expand_more
format_list_bulleted
Videos
Textbook Question
Chapter 2, Problem 73PS
Examine the following visualization, adapted from a management consulting while paper.
When manages believe they will need to make major changes to their IT infrastructure to combat resource scarcity
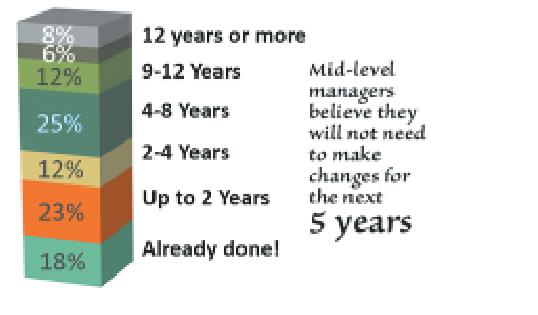
a. Describe at least one good feature of this visual display.
b. Describe at least one bad feature of this visual display.
c. Redraw the graph, by using the Exhibit 2.1 guidelines.
Expert Solution & Answer
Want to see the full answer?
Check out a sample textbook solution
Students have asked these similar questions
According to the graph, which type of mass transit is not a cost-effective option for a small city? (options)
light rail
heavy rail
commuter rail
bus
If there was a baby boom of Oompa Loompas ready to work for free, what will happen to the Willy Wonka chocolate market? A few things to think about:
Has this affected supply or demand of Willy Wonka Chocolate?
What has happened to the price of Willy Wonka chocolate?
Please justify your answer by graphing the change in either supply or demand, as well as the change in price.
GRAPH THEORY. Please I need part A and B . Thank you
Chapter 2 Solutions
EP BASIC BUS.STATS-ACCESS (18 WEEKS)
Ch. 2 - A categorical variable has three categories, with...Ch. 2 - The following data represent the responses to two...Ch. 2 - The following table, stored in Smartphones Sales,...Ch. 2 - The Consumer Financial Protection Bureau reports...Ch. 2 - In addition to the impact of Big Data, what...Ch. 2 - This table represents the summer power-generating...Ch. 2 - Timetric’s 2016 survey of insurance...Ch. 2 - A survey of 1,520 Americans adults asked “Do you...Ch. 2 - A study of selected Kickstarter projects showed...Ch. 2 - Do special recommendations increase ad...
Ch. 2 - Construct an ordered array, given the following...Ch. 2 - Construct an ordered array, given the following...Ch. 2 - Planning and preparing for the unexpected,...Ch. 2 - Data was collected on salaries of compliance...Ch. 2 - The file NBACost contains the total cost ($ ) for...Ch. 2 - The file Utility contains the following data about...Ch. 2 - How much time do commuters living in or near...Ch. 2 - How do the average credit scores of people living...Ch. 2 - One operation of a mill is to cut pieces of steel...Ch. 2 - Call centers today play an important role in...Ch. 2 - The financial service call centre in problem 2.20...Ch. 2 - The file Bulbs contains the life (in hours) of a...Ch. 2 - The file Drink Contains the following data for the...Ch. 2 - A survey of online shoppers revealed that in 2015...Ch. 2 - How do college students spend their day? The 2016...Ch. 2 - The Energy Information Administration reported the...Ch. 2 - The Consumer Financial Protection Bureau reports...Ch. 2 - The following table indicates the percentage of...Ch. 2 - Timetric’s 2016 survey of insurance...Ch. 2 - A survey of 1,520 American adults asked “Do you...Ch. 2 - A study of selected Kickstarter projects showed...Ch. 2 - Do special recommendations increase ad...Ch. 2 - Construct a stern-and-leaf display, given the...Ch. 2 - Construct an ordered array, given the following...Ch. 2 - The following is a stern-and0-leaf display...Ch. 2 - The file NBACost contains the total cost in$ for...Ch. 2 - The file MobileSpeed contains the overall download...Ch. 2 - The file Utility contains the following data about...Ch. 2 - As player salaries have increases, the cost of...Ch. 2 - The following histogram and cumulative percentage...Ch. 2 - How much time do Americans living in cities spend...Ch. 2 - How do the average credit scores of people living...Ch. 2 - One operation of a mill is to cut pieces of steel...Ch. 2 - Call centers today play an important role in...Ch. 2 - The financial service call center in problem 2.44...Ch. 2 - The file Bulbs contains the life (in hours) of a...Ch. 2 - The data stored in Drink represents the amount of...Ch. 2 - The following is a set of data from a sample of...Ch. 2 - The following is a series of annual sales...Ch. 2 - Movie companies need to predict the gross receipts...Ch. 2 - Data were collected on the typical cost of dining...Ch. 2 - The file Mobile contains the overall download and...Ch. 2 - A Pew Research Center survey found a noticeable...Ch. 2 - How have stocks performed in the past? The...Ch. 2 - The file NewHomeSales contains the number of new...Ch. 2 - The file Movie Attendance 16 contains the yearly...Ch. 2 - The Super Bowl is a big viewing event watched by...Ch. 2 - Using the sample of retirement funds stored in...Ch. 2 - Using the sample of retirement funds stored in...Ch. 2 - Prob. 60PSCh. 2 - Using the sample of retirement funds stored in...Ch. 2 - Prob. 62PSCh. 2 - Using the sample of retirement funds stored in...Ch. 2 - Prob. 64PSCh. 2 - Using the sample of retirement funds stored in...Ch. 2 - Prob. 66PSCh. 2 - Prob. 67PSCh. 2 - Prob. 68PSCh. 2 - Prob. 71PSCh. 2 - Prob. 72PSCh. 2 - Examine the following visualization, adapted from...Ch. 2 - Prob. 75PSCh. 2 - Prob. 76PSCh. 2 - How do histograms and polygons differ in...Ch. 2 - Why would you construct a summary table?Ch. 2 - What are the advantages and disadvantage of using...Ch. 2 - Compare and contrast the bar chart for categorical...Ch. 2 - What is the difference between a time-series plot...Ch. 2 - Why is it said that the main feature of a Pareto...Ch. 2 - What are the three different ways to break down...Ch. 2 - How can a multidimensional table differ from a...Ch. 2 - What type of insights can you gain from a...Ch. 2 - Prob. 86PSCh. 2 - What is the difference between a time-series plot...Ch. 2 - The following table shown in the TextbookCosts...Ch. 2 - The following table represents the market share...Ch. 2 - B2B marketers in North America were surveyed about...Ch. 2 - The owner of a restaurant that services...Ch. 2 - Suppose that the owner of the restaurant in...Ch. 2 - The following data represents the pounds per...Ch. 2 - The Air Travel Consumer Report, a monthly product...Ch. 2 - One of the major measures of the quality of...Ch. 2 - The file DomesticBeer Contains the percentage...Ch. 2 - Prob. 97PSCh. 2 - The file CDRate contains the yields for one-year...Ch. 2 - The file CEO 2016 includes the total compensation...Ch. 2 - Prob. 100PSCh. 2 - What was the average price of a room at two-star,...Ch. 2 - The file Protein contains calorie and cholesterol...Ch. 2 - The file Natural Gas contains the U.S. monthly...Ch. 2 - The data stored in Drink represent the amount of...Ch. 2 - Prob. 105PSCh. 2 - A/B testing allows business to test a new design...Ch. 2 - Referring to the results from Problem 2.100 on...
Knowledge Booster


Learn more about
Need a deep-dive on the concept behind this application? Look no further. Learn more about this topic, statistics and related others by exploring similar questions and additional content below.Similar questions
- A large, profitable commercial airline companyflies 737-type aircraft, each with a maximum seatingcapacity of 132 passengers. Company literature statesthat the economic breakeven point with these aircraft is62 passengers. (2.2)a. Draw a conceptual graph to show total revenue andtotal costs that this company is experiencing.b. Identify three types of fixed costs that the airlineshould carefully examine to lower its breakevenpoint. Explain your reasoning.c. Identify three types of variable costs that canpossibly be reduced to lower the breakeven point.Why did you select these cost items?arrow_forwardIdentify an LP problem and construct a model that describes it. Make sure to include the following: 1. Quick discussion on what motivates you to choose that problem; 2. Define the problem; 3. Define the variables;arrow_forwardRon attends a cocktail party (with his graphing calculator in his pocket). He wants to limit his food intake to 143 g protein, 130 g fat, and 162 g carbohydrate. According to the health conscious hostess, the marinated mushroom caps have 3 g protein, 5 g fat, and 9 g carbohydrate, the spicy meatbals have 14 g protein, 7g fat, and 15 g carbohydrate, and the deviled eggs have 13 g protein, 15 g fat, and 6 g carbohydrate. How many of each snack can he eat to obtain his goal? O A. 4 mushrooms, 7 meatballs, 5 eggs O B. 5 mushrooms, 4 meatballs, 7 eggs OC. 8 mushrooms, 6 meatballs, 5 eggs OD. 7 mushrooms, 5 meatballs, 4 eggs O Time Remaining: 00 4851 Next DELL F11 PriScr Delete F12 Insert F4 F6 F7 FB F9 F10 F2 4. Esc F3 F5 41 44 PAA VA 144 %23 &. Backspace 2 3. 4. 6. 7. R T. Tab H. Karrow_forward
- Ron attends a cocktail party (with his graphing calculator in his pocket). He wants to limit his food intake to 143 g protein, 130 g fat, and 162 g carbohydrate. According to the health conscious hostess, the marinated mushroom caps have 3 g protein, 5 g fat, and 9 g carbohydrate; the spicy meatballs have 14 g protein, 7 g fat, and 15 g carbohydrate; and the deviled eggs have 13 g protein, 15 g fat, and 6 g carbohydrate. How many of each snack can he eat to obtain his goal?arrow_forward2. Use the graph below to answer the items that follow: pain_data$sex -0- female male A В C Treatment Type a. Is there a main effect of Sex? Explain b. Is there a main effect of Treatment? Explain. c. Is there an interaction between Sex and Treatment? Explain. Time (in minutes) 15 25 35 07arrow_forwardWhat are the two balancing factors you should consider when you are resizing a typical chart or graph.arrow_forward
- Which claim can be made from the information given in the graph? Shoe Sales 35 30 25 20 15 10 Sandals Casual shoes Вoots Dress shoes Sport shoes Shoe Type © 2019 Glynlyon, Inc. O Boots make less profit than casual shoes. O Sandals sell best in the summer. O Sales are decreasing. O Sport shoes account for the fewest sales. Percent of Salesarrow_forwardGraph theory.Kindly handwritten and correctlyarrow_forwardThe main three components of any graph are: Select one: a. Coordinates, Aesthetics, and Data b. Data, Aesthetics, and Geometrics c. Geometrics, Themes, and Data d. Statistics, Aesthetics, and Geometrics e. Data, Geometrics, and Coordinatesarrow_forward
- the restaurant value stream map, and recompute the total value-added and non-value-added time and cost given the following new information. The chef's time is valued at $30 per hour, oven operation at $10 per hour, precooking order waiting time at $5 per hour, and postcooking order waiting time at $60 per hour. The $60 estimate reflects the cost of poor quality for a dinner waiting too long that might be delivered to the customer late (and cold). If a restaurant uses iPads to place orders and notify waiters when the customer's order is ready, the time on the order board (now an electronic order board) decreases from five to one minute, and the prepared order wait time decreases from five to four minutes. Round your answer for the total revised time to the nearest whole number and round your answer for the total revised cost to three decimal places. Total Revised Time: minutes Total Revised Cost: $arrow_forwardWhat do you think are the advantages of understanding the development of Process Flow Diagram? Is it necessary for industrial engineers to know the creation of this chart? Why? Answer in 20 sentences.arrow_forwardCan you please explain and interpret the following table and graph.arrow_forward
arrow_back_ios
SEE MORE QUESTIONS
arrow_forward_ios
Recommended textbooks for you
 Linear Algebra: A Modern IntroductionAlgebraISBN:9781285463247Author:David PoolePublisher:Cengage Learning
Linear Algebra: A Modern Introduction
Algebra
ISBN:9781285463247
Author:David Poole
Publisher:Cengage Learning
What Are Research Ethics?; Author: HighSchoolScience101;https://www.youtube.com/watch?v=nX4c3V23DZI;License: Standard YouTube License, CC-BY
What is Ethics in Research - ethics in research (research ethics); Author: Chee-Onn Leong;https://www.youtube.com/watch?v=W8Vk0sXtMGU;License: Standard YouTube License, CC-BY