
Concept explainers
Videos
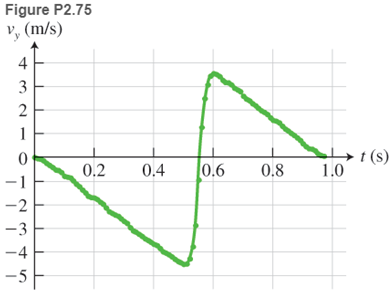
* Oliver drops a tennis ball from a certain height above a concrete floor. Figure P2.75 shows the velocity-versus-time graph of the ball’s motion from the moment the ball is released to the moment the ball reaches its maximum height after bouncing up from the floor. (a) How is the y-axis directed: up or down? (b) Determine the initial height from which the ball is released and the final height to which the ball bounces. (c) Determine the average speed of the ball during the downward motion.
Want to see the full answer?
Check out a sample textbook solution
Chapter 2 Solutions
COLLEGE PHYSICS,AP ED.-ACCESS
Additional Science Textbook Solutions
Tutorials in Introductory Physics
Conceptual Physical Science (6th Edition)
Lecture- Tutorials for Introductory Astronomy
Essential University Physics: Volume 1 (3rd Edition)
Conceptual Physics (12th Edition)
University Physics (14th Edition)


- A glider of length moves through a stationary photogate on an air track. A photogate (Fig. P2.44) is a device that measures the time interval td during which the glider blocks a beam of infrared light passing across the photogate. The ratio vd = /td is the average velocity of the glider over this part of its motion. Suppose the glider moves with constant acceleration. (a) Argue for or against the idea that vd is equal to the instantaneous velocity of the glider when it is halfway through the photogate in space. (b) Argue for or against the idea that vd is equal to the instantaneous velocity of the glider when it is halfway through the photogate in time.arrow_forwardA student drives a moped along a straight road as described by the velocity-versus-time graph in Figure P2.12. Sketch this graph in the middle of a sheet of graph paper. (a) Directly above your graph, sketch a graph of the position versus time, aligning the time coordinates of the two graphs. (b) Sketch a graph of the acceleration versus time directly below the velocity-versus-time graph, again aligning the time coordinates. On each graph, show the numerical values of x and ax for all points of inflection. (c) What is the acceleration at t = 6.00 s? (d) Find the position (relative to the starting point) at t = 6.00 s. (e) What is the mopeds final position at t = 9.00 s? Figure P2.12arrow_forwardAn object that moves in one dimension has the velocity-versus-time graph shown in Figure P2.52. At time t = 0, the object has position x = 0. a. At time t = 5 s. is the acceleration of the object positive, negative, or zero? Explain. b. At time t = 8 s, is the object speeding up, showing down, or moving with constant speed? Explain. c. Write an expression for the position of the object as a function of time. Explain how you use the graph to obtain your answer. d. Use your expression from part (c) to determine the time (if any) at which the object reaches its maximum position. Check your results by examining the graph. Hint: To get started with finding the maximum of a function, take the derivative and set it equal to zero.arrow_forward
- A student drives a moped along a straight road as described by the velocitytime graph in Figure P2.32. Sketch this graph in the middle of a sheet of graph paper. (a) Directly above your graph, sketch a graph of the position versus time, aligning the time coordinates of the two graphs. (b) Sketch a graph of the acceleration versus time directly below the velocitytime graph, again aligning the time coordinates. On each graph, show the numerical values of x and ax for all points of inflection. (c) What is the acceleration at t = 6.00 s? (d) Find the position (relative to the starting point) at t = 6.00 s. (e) What is the mopeds final position at t = 9.00 s? Figure P2.32arrow_forward6. A car travels 21 miles in 20 minutes.a. How many hours did the car spend traveling?b. What was the average velocity of the car in miles per hour during its trip?c. After reaching its destination, suppose the car travels an additional 100 milesover 2.5 hours. Find the average velocity of the car in mph over this second trip.d. Find the average velocity of the car in mph over the combined legs of the trip.e. Draw and label a position vs. time graph showing the trip the car made. Includelines for each leg of the trip as well as the combined journey.f. Compare the slopes of each line. Are any of the average velocities the same?Should they be?arrow_forward(a) Differentiate between speed and velocity. (b) The speed versus time graph for an object is shown below: (i) Describe the motion of the object. (ii) Calculate the total distance covered by the object in 10 s. (iii) Calculate the average speed of the object after 10 s.arrow_forward
- Does a real automobile have constant acceleration? Measured data for aPorsche 944 Turbo at maximum acceleration are as shown in the table.a. Convert the velocities to m/s, then make a graph of velocity versus time.Based on your graph, is the acceleration constant? Explain.b. Estimate how far the car traveled in the first 10 s.c. Draw a smooth curve through the points on your graph, then use your graph to estimate the car’s acceleration at 2.0 s and 8.0 s. Give your answer in SI units. Hint: Remember that acceleration is the slope of the velocity graph.arrow_forwardA race car moves such that its position fits the relationship x = (5.0 m/s)t + (0.75 m/s3)t3 where x is measured in meters and t in seconds. (a) Plot a graph of the car’s position versus time. (b) Determine the instantaneous velocity of the car at t = 4.0 s, using time intervals of 0.40 s, 0.20 s, and 0.10 s. (c) Compare the average velocity during the first 4.0 s with the results of part (b).arrow_forwardThe velocity-versus-time graph for a car driving down a straight road is shown. What is the acceleration of the car during the period shown?A. 1.0 m/s2 B. 2.5 m/s2C. 3.8 m/s2 D. 5.0 m/s2arrow_forward
- Suppose that a tennis ball is dropped from the top of a skyscraper. Taking the ball’s initial position zero (y=0) and choosing y-axis positive in the downward direction, for this free-fall motion, Draw the acceleration vs. time, velocity vs. time and position vs. time graphs. Calculate the position, velocity, and acceleration of the ball at t= 5.0 seconds. Use Kinematics equations. (g=9.80 mls2)arrow_forwardFigure below shows v(t) for a world-class track sprinter in a 100-m race. (a) What is his average velocity for the first 4 s? (b) What is his instantaneous velocity at t = 5 s ? (c) What is his average acceleration between 0 and 4 s? (d) What is his time for the race? (e) Draw the corresponding acceleration graph.arrow_forwardFigure P2.9 shows a graph of vx versus t for the motion of a motorcyclist as he starts from rest and moves along the road in a straight line. (a) Find the average acceleration for the time interval t = 0 to t = 6.00 s. (b) Estimate the time at which the acceleration has its greatest positive value and the value of the acceleration at that instant. (c) When is the acceleration zero? (d) Estimate the maximum negative value of the acceleration and the time at which it occurs. Figure P2.9arrow_forward
 Glencoe Physics: Principles and Problems, Student...PhysicsISBN:9780078807213Author:Paul W. ZitzewitzPublisher:Glencoe/McGraw-Hill
 Principles of Physics: A Calculus-Based TextPhysicsISBN:9781133104261Author:Raymond A. Serway, John W. JewettPublisher:Cengage Learning
 Physics for Scientists and Engineers with Modern ...PhysicsISBN:9781337553292Author:Raymond A. Serway, John W. JewettPublisher:Cengage Learning
 Physics for Scientists and EngineersPhysicsISBN:9781337553278Author:Raymond A. Serway, John W. JewettPublisher:Cengage Learning
 Physics for Scientists and Engineers, Technology ...PhysicsISBN:9781305116399Author:Raymond A. Serway, John W. JewettPublisher:Cengage Learning
 Physics for Scientists and Engineers: Foundations...PhysicsISBN:9781133939146Author:Katz, Debora M.Publisher:Cengage Learning