
a.
To explain: Matched pairs design.
a.
Answer to Problem 20.33E
The newt’s ability to heal in one leg depends on the newt’s ability to heal in another leg. Moreover, the two hind limbs namely, control limb and experimental limb are matched by newt.
Explanation of Solution
Given info:
In the experiment, the two hind limbs of 12 newts were assigned at random to either experimental or control group.
Justification:
Matched pairs:
If the sample values from one population are associated or matched with the sample values from another population, then the two samples are said to be matched pairs or dependent samples.
Matched pair design occurs at two situations, which are listed below:
- Subjects are matched with pairs and each treatment is given to one subject in each pair
- Before and after observations on the same subjects.
In the given experiment, the newt’s ability to heal in one leg depends on the newt’s ability to heal in another leg. This indicates that the samples are not independent. Thus, the two hind limbs namely, control limb and experimental limb are matched by newt.
b.
To construct: The stemplot of the differences between limbs of the same newt and also to check whether there is a high outlier or not.
b.
Answer to Problem 20.33E
Output using the MINITAB software is given below:
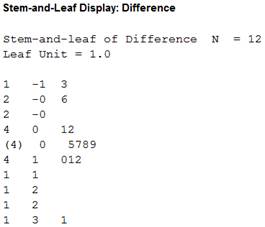
The stemplot plot clearly establishes the extreme outlier mentioned in the question.
Explanation of Solution
Calculation:
Software procedure:
Step-by-step procedure to construct the stemplot using the MINITAB software:
- Select Graph > Stem and leaf.
- In Graph variables, select Difference.
- Select OK
Interpretation:
There is sign of a major deviation from normality because the shape of the distribution is not a bell shape. That is, the stemplot suggests that the distribution of the data is skewed to the right with an extreme outlier (31). Thus, the stemplot plot clearly establishes the extreme outlier mentioned in the question.
c.
To find: The test statistic and P value with one test including all 12 newts and another omitting the outlier.
To check: Whether the outliers have a strong influence on conclusion or not.
c.
Answer to Problem 20.33E
There is sufficient evidence to support the claim for the mean healing rate is significantly lower in the experimental limbs with all 12 differences.
When omitting the outliers from the data set, there is weaker evidence to support the claim for the mean healing rate being significantly lower in the experimental limbs.
Yes, the outliers have a strong influence on the conclusion.
Explanation of Solution
Given info:
The mean healing rate is significantly lower in the experimental limbs with one test including all 12 newts and another omitting the outlier.
Calculation:
The null and alternative hypotheses are given below:
Null hypothesis:
Alternative hypothesis:
Test statistic and P-value for original data:
Software procedure:
Step-by-step procedure to obtain the test statistic and P-value for the original data using the MINITAB software:
- Choose Stat > Basic Statistics > 1-Sample t.
- In Samples in Column, enter the column of “Difference”.
- In Perform hypothesis test, enter the test mean as 0.
- Check Options, enter Confidence level as 95.0.
- Choose greater than in alternative.
- Click OK in all dialogue boxes.
Output using the MINITAB software is given below:
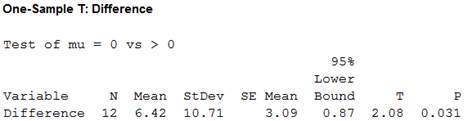
Thus, the test statistic is 2.08 and the P-value is 0.031.
Decision criteria for the P-value method:
If
If
Conclusion:
Here, the P-value for the hypotheses tests is 0.031, which is less than the level of significance. That is,
Test statistic and P-value when omitting the outlier:
Software procedure:
Step-by-step procedure to obtain the test statistic and P-value when omitting the outlier using the MINITAB software:
- Choose Stat > Basic Statistics > 1-Sample t.
- In Samples in Column, enter the column of “Difference”.
- In Perform hypothesis test, enter the test mean as 0.
- Check Options, enter Confidence level as 95.0.
- Choose greater than in alternative.
- Click OK in all dialogue boxes.
Output using the MINITAB software is given below:
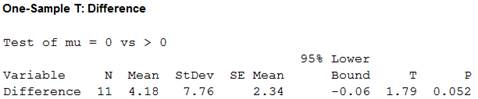
Thus, the test statistic is 1.79 and the P-value is 0.052.
Conclusion:
Here, the P-value for the hypotheses test is 0.052, which is greater than the level of significance. That is,
Comparison:
There is sufficient evidence to support the claim for the mean healing rate being significantly lower in the experimental limbs with all 12 differences. But, there is a weaker evidence to support the claim for the mean healing rate being significantly lower in the experimental limbs when omitting the outliers from the data set.
d.
To construct: The modified boxplot of the differences between the limbs of the same newt.
To find: The test statistic and P value with one test including all 12 newts and another omitting both the outliers.
To check: Whether the outliers have a strong influence on the conclusion or not.
To compare: The obtained test result with the result in part (c).
d.
Answer to Problem 20.33E
Output using the MINITAB software is given below:
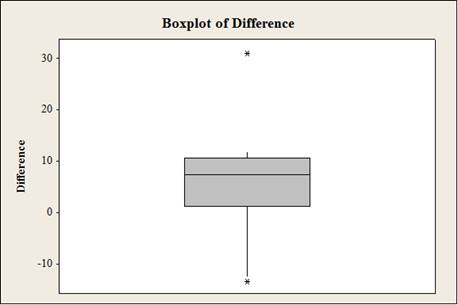
The graph suggests the distribution of the data skewed with two outliers.
Yes, the outliers have a strong influence on the conclusion.
When omitting the two outliers from the data set, there is stronger evidence to support the claim for the mean healing rate. It is significantly lower in the experimental limbs than the result in part (c).
Explanation of Solution
Calculation:
Software procedure:
Step-by-step procedure to construct the box plot for the original data using the MINITAB software:
- Choose Graph > Boxplot or Stat > EDA > Boxplot.
- Under Single Y, choose Simple. Click OK.
- In Graph variables, enter the data of Newts.
- Click OK.
Graph interpretation:
The boxplot suggests that the distribution of the data skewed with two extreme outliers (–13 and 31).
Test statistic and P-value after omitting the outliers:
Software procedure:
Step-by-step procedure to obtain the test statistic and P-value when omitting the outliers using the MINITAB software:
- Choose Stat > Basic Statistics > 1-Sample t.
- In Samples in Column, enter the column of “Difference”.
- In Perform hypothesis test, enter the test mean as 0.
- Check Options, enter Confidence level as 95.0.
- Choose greater than in alternative.
- Click OK in all dialogue boxes.
Output using the MINITAB software is given below:
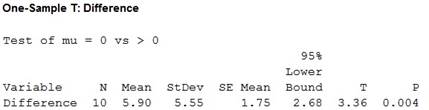
Thus, the test statistic is 3.36 and the P-value is 0.004.
Conclusion:
Here, the P-value for the hypotheses test is 0.004, which is less than the level of significance. That is,
Comparison:
There is strong evidence to support the claim for the mean healing rate being significantly lower in the experimental limbs after omitting the outliers from the data set when compared to the result in part (c).
Want to see more full solutions like this?
Chapter 20 Solutions
BASIC PRACTICE OF STATISTICS >C<

 MATLAB: An Introduction with ApplicationsStatisticsISBN:9781119256830Author:Amos GilatPublisher:John Wiley & Sons Inc
 Probability and Statistics for Engineering and th...StatisticsISBN:9781305251809Author:Jay L. DevorePublisher:Cengage Learning
 Statistics for The Behavioral Sciences (MindTap C...StatisticsISBN:9781305504912Author:Frederick J Gravetter, Larry B. WallnauPublisher:Cengage Learning
 Elementary Statistics: Picturing the World (7th E...StatisticsISBN:9780134683416Author:Ron Larson, Betsy FarberPublisher:PEARSON
 The Basic Practice of StatisticsStatisticsISBN:9781319042578Author:David S. Moore, William I. Notz, Michael A. FlignerPublisher:W. H. Freeman
 Introduction to the Practice of StatisticsStatisticsISBN:9781319013387Author:David S. Moore, George P. McCabe, Bruce A. CraigPublisher:W. H. Freeman