
Concept explainers
Videos
(a)
To find: The
(a)
Answer to Problem 21E
Solution: The expected size of the household is approximately 3.
Explanation of Solution
Calculation:
The expected value of any discrete random variable X is computed by using the following formula:
where
Using the above formula of expectation and the provided probability distribution of the size of a household, the expected value of the size of a household
(b)
To find: The number of households of size 2.
(b)
Answer to Problem 21E
Solution: There are 340 households of size 2.
Explanation of Solution
Calculation:
The number of households of size 2 is computed as follows:
To find: The number of households of sizes 3 to 7.
Solution: There are 380 households of sizes 3 to 7.
Explanation:
Calculation:
From the provided probability distribution, the proportion for the households of sizes 3 to 7 is calculated as follows:
Now, the number of households of sizes 3 to 7 is calculated as follows:
(c)
To find: The number of people represented in the sample of 1000 households.
(c)
Answer to Problem 21E
Solution: A total number of 2450 people are represented by the sample.
Explanation of Solution
Calculation:
The number of people represented in the sample is calculated from the provided probability distribution as follows:
(d)
To find: The probability distribution for household size and the shape of the obtained distribution.
(d)
Answer to Problem 21E
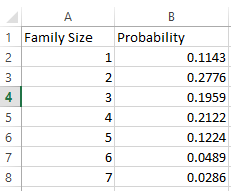
Solution: The required probability distribution is shown below:
The shape of the distribution is rightskewed.
Explanation of Solution
Calculation:
From the provided probability distribution, the family size is calculated as displayed in the table below:
The probability corresponding to each of the family size is computed as shown below:
Graph: Now to determine the shape of the above obtained probability distribution, enter the data in Excel as displayed below:
Next select the entered data and go to “Insert” and select the “2-D Column” as shown in the screenshot below:

The obtained bar chart is shown below:
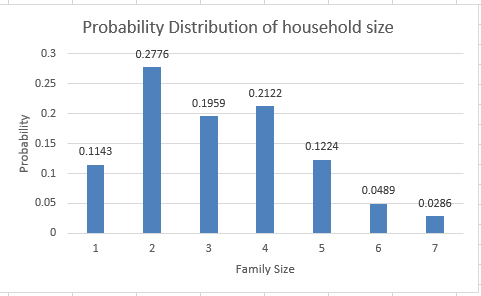
From the above graphical representation of the probability distribution, it is clear that the distribution is right skewed and as the family size increases the probability of the size of household decreases.
Interpretation: The probability distribution of the household size describes the probability associated with each of the household corresponding to the number of members living in it. The distribution is skewed toward right and it is concluded that the families of large size are less probable. Most of the households tend to have a size of 2.
Want to see more full solutions like this?
Chapter 20 Solutions
Loose-leaf Version for Statistics: Concepts and Controversies


 MATLAB: An Introduction with ApplicationsStatisticsISBN:9781119256830Author:Amos GilatPublisher:John Wiley & Sons Inc
 Probability and Statistics for Engineering and th...StatisticsISBN:9781305251809Author:Jay L. DevorePublisher:Cengage Learning
 Statistics for The Behavioral Sciences (MindTap C...StatisticsISBN:9781305504912Author:Frederick J Gravetter, Larry B. WallnauPublisher:Cengage Learning
 Elementary Statistics: Picturing the World (7th E...StatisticsISBN:9780134683416Author:Ron Larson, Betsy FarberPublisher:PEARSON
 The Basic Practice of StatisticsStatisticsISBN:9781319042578Author:David S. Moore, William I. Notz, Michael A. FlignerPublisher:W. H. Freeman
 Introduction to the Practice of StatisticsStatisticsISBN:9781319013387Author:David S. Moore, George P. McCabe, Bruce A. CraigPublisher:W. H. Freeman