
Videos
Compute the price relatives for the four stocks making up the Boran index in exercise 20. Use the weighted aggregates of price relatives to compute the January 2011 and March 2011 Boran indexes.
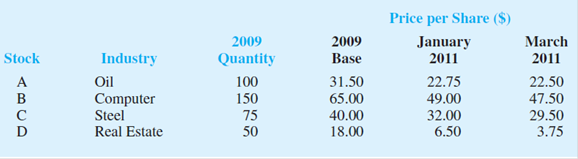
20. Boran Stockbrokers, Inc., selects four stocks for the purpose of developing its own index of stock market behavior. Prices per share for a 2009 base period, January 2011, and March 2011 follow. Base-year quantities are set on the basis of historical volumes for the four stocks.
Use the 2009 base period to compute the Boran index for January 2011 and March 2011. Comment on what the index tells you about what is happening in the stock market.
Find the price relatives for the four stocks making up the Boran index in Exercise 20.
Find the January 2011 and March 2011 Boran indexes by using the weighted aggregates of price relatives.
Answer to Problem 21SE
The price relatives for the four stocks for January 2011 are obtained below:
| Year | 2009 Base | January 2011 | |
| Oil | 31.50 | 22.75 | 72.2 |
| Computer | 65 | 49 | 75.4 |
| Steel | 40 | 32 | 80 |
| Real Estate | 18 | 6.50 | 36.1 |
The price relatives for the four stocks for March 2011 is obtained below:
| Year |
2009 Base | March 2011 | |
| Oil | 31.50 | 22.50 | 71.4 |
| Computer | 65 | 47.50 | 73.1 |
| Steel | 40 | 29.50 | 73.8 |
| Real Estate | 18 | 3.75 | 20.8 |
The Boran index for January 2011 by using the weighted aggregates of price relatives is 73.5.
The Boran index for March 2011 by using the weighted aggregates of price relatives is 70.10.
Explanation of Solution
Calculation:
The data represents the price per share for the periods January 2011, March 2011 and 2009 Base. Furthermore, the values of 2009 Quantity are also given.
The price relatives for the four stocks for January 2011 are obtained below:
| Year | 2009 Base | January 2011 | |
| Oil | 31.50 | 22.75 | |
| Computer | 65 | 49 | |
| Steel | 40 | 32 | |
| Real Estate | 18 | 6.50 |
The price relatives for the four stocks for March 2011 is obtained below:
| Year |
2009 Base | March 2011 | |
| Oil | 31.50 | 22.50 | |
| Computer | 65 | 47.50 | |
| Steel | 40 | 29.50 | |
| Real Estate | 18 | 3.75 |
The Boran index for January 2011 and March 2011 by using the weighted aggregates of price relatives is obtained below:
Thus, the Boran index for January 2011 by using the weighted aggregates of price relatives is 73.5.
The Boran index for March 2011 by using the weighted aggregates of price relatives is obtained below:
Thus, the Boran index for March 2011 by using the weighted aggregates of price relatives is 70.10.
Want to see more full solutions like this?
Chapter 20 Solutions
EBK STATISTICS FOR BUSINESS & ECONOMICS


- p1. Construct simple aggregative price index from the following data : Commodities Prices in 2015 $ Prices in 2016 $ 1 15.00 18.00 11 5.00 8.00 111 2.25 4.00 IV 6.00 7.00arrow_forwardPrice information for selected foods for 2010 and 2018 is given in the table. Price Quantity Item 2010 2018 2010 2018 Cabbage (pound) $ 0.06 $ 0.05 2,000 1,500 Carrots (bunch) 0.10 0.12 200 200 Peas (quart) 0.20 0.18 400 500 Endive (bunch) 0.15 0.15 100 200 Compute a simple price index for each of the four items. Use 2010 as the base period. (Round your answers to 2 decimal places.)arrow_forwardUse the accompanying data table regarding retirement funds. Complete parts (a) through (d) below. a. Construct a growth and value table that tabulates type, market cap, risk,and rating.arrow_forward
- The table below contains monthly share prices for Pfizer Inc. (PFE) and Astrazeneca Plc. (AZN). It also contains the monthly prices for the S&P 5000 index (S&PCOMP). Date Time S&PCOMP PFE AZN 2/1/2019 0 2510.03 43.25 37.80 1/2/2019 1 2706.53 42.88 36.65 1/3/2019 2 2803.69 43.36 41.76 1/4/2019 3 2867.19 42.84 41.27 1/5/2019 4 2923.73 40.77 37.35 3/6/2019 5 2744.45 41.92 37.90 1/7/2019 6 2964.33 43.77 41.31 1/8/2019 7 2953.56 38.25 44.00 3/9/2019 8 2906.27 36.12 45.27 1/10/2019 9 2940.25 35.43 43.66 1/11/2019 10 3066.91 38.39 48.39 2/12/2019 11 3113.87 38.29 48.38 2/1/2020 12 3257.85 39.14 50.39 3/2/2020 13 3248.92 37.51 48.51 2/3/2020 14 3090.23 34.88 45.87 1/4/2020 15 2470.50 31.75 43.78 1/5/2020 16 2830.71 37.64 51.86 1/6/2020 17 3055.73 35.46 55.16 1/7/2020 18 3115.86 33.74 53.32 3/8/2020 19 3294.61 38.35 56.82 1/9/2020 20 3526.65 36.88 55.38 1/10/2020 21 3380.80 36.37 54.30 2/11/2020 22 3310.24 36.23 50.62 1/12/2020 23…arrow_forwardTable 1 displays data for money aggregates released by the Central Bank, Country A for the years 2019 - 2021. TABLE 1 2020 (Jan) $ Million 2021 (Jan) 2019 (Jan) $ Million Items $ Million Repurchase agreements Currency in circulation Demand deposits Fixed deposits with commercial banks, Islamic banks and central bank 50.8 105,091.5 344,140.6 0.0 53.5 101,254.1 326.976.9 1,130,449.7 123,007.5 412,203.8 1,158,924.1 1,120,366.7 Foreign currency deposits with commercial banks, Islamic banks and central bank Deposits placed with other banking institutions 145,887.1 155,502.5 159,817.5 9,698.1 10,556.70 2,558.7 Saving deposits with commercial banks Negotiable instruments of deposits 162,067.8 172,797.0 218,820.0 12,375.3 14,366.6 8,824.5 a) Based on the data in Table 1, answer the following questions: i) What is the value of quasi money in 2020? ii) Calculate the values of M2 for 2021arrow_forwardSuppose that the Producer Price Index and the sales of Hoskin’s Wholesale Distributors for 2006 and 2018 are: What are Hoskin's real sales (also called deflated sales) for the 2 years? (Round your answers to the nearest whole dollar.)arrow_forward
- a) The cost of an 'average' television has fallen over recent years. 2017 2018 2019 2020 £950 £820 £740 £630 Convert the costs into an index using 2017 as the base year.arrow_forwardThe following are the index numbers of wholesale prices of a commodity based on 2011: Year Index Numbers Year Index Numbers 2011 2012 2013 2014 100 108 2015 2016 2017 210 225 240 120 150 Prepare new Index Numbers taking 2013 as base.arrow_forward4. The following table provides the average price of Regular Grade of gasoline for 4 years. Use 2015 as the reference value, complete the table by calculating the price index for each year. Show all your calculation in the space provided. Date 2013 2014 2015 2016 Regular Grade Gasoline Prices Price $3.505 $3.358 $2.429 $2.143 Price Indexarrow_forward
- Under the last-in, first-out (LIFO) inventory valuation method, a price index for inventory must be established for tax purposes. The quantity weights are based on year-ending inventory levels. Use the beginning-of-the-year price per unit as the base-period price and develop a weighted aggregate index for the total inventory value at the end of the year. (Round your answer to the nearest integer.) �= What type of weighted aggregate price index must be developed for the LIFO inventory valuation? Paasche index Laspeyres Indexarrow_forwardPrice information for selected foods for 2010 and 2018 is given in the table. Determine a value index for 2018 using 2010 as the base period. (Round your answer to 2 decimal places.)arrow_forwardThe following table shows a data set containing information for 45 mutual funds that are part of the Morningstar Funds 500 for 2008. . The data set includes the following five variables: Use Excel to answer the following question: a. Prepare a crosstabulation of the data on Fund Type (row variable) and the average annual return over the past 5 years (column variable). Use classes of 0–10, 10–20, 20–30, 30–40, 40–50, and 50–60 for the 5-Year Average Return (%) (Class width is 10). B. Construct frequency distributions for Fund Type and 5-Year Average Return (%) respectively. Based on the frequency distributions of the two variables, which of the following answers is wrong? Group of answer choices Out of the 45 mutual funds, there are 2 funds with 5-year average return of 30 - 40 (%). Out of the 45 mutual funds, there are 28 funds with 5-year average return of 10 - 20 (%). Out of the 45 mutual funds, there are 28 DE type of funds. Out of the 45 mutual funds, there are 10…arrow_forward
 MATLAB: An Introduction with ApplicationsStatisticsISBN:9781119256830Author:Amos GilatPublisher:John Wiley & Sons Inc
 Probability and Statistics for Engineering and th...StatisticsISBN:9781305251809Author:Jay L. DevorePublisher:Cengage Learning
 Statistics for The Behavioral Sciences (MindTap C...StatisticsISBN:9781305504912Author:Frederick J Gravetter, Larry B. WallnauPublisher:Cengage Learning
 Elementary Statistics: Picturing the World (7th E...StatisticsISBN:9780134683416Author:Ron Larson, Betsy FarberPublisher:PEARSON
 The Basic Practice of StatisticsStatisticsISBN:9781319042578Author:David S. Moore, William I. Notz, Michael A. FlignerPublisher:W. H. Freeman
 Introduction to the Practice of StatisticsStatisticsISBN:9781319013387Author:David S. Moore, George P. McCabe, Bruce A. CraigPublisher:W. H. Freeman