
Videos
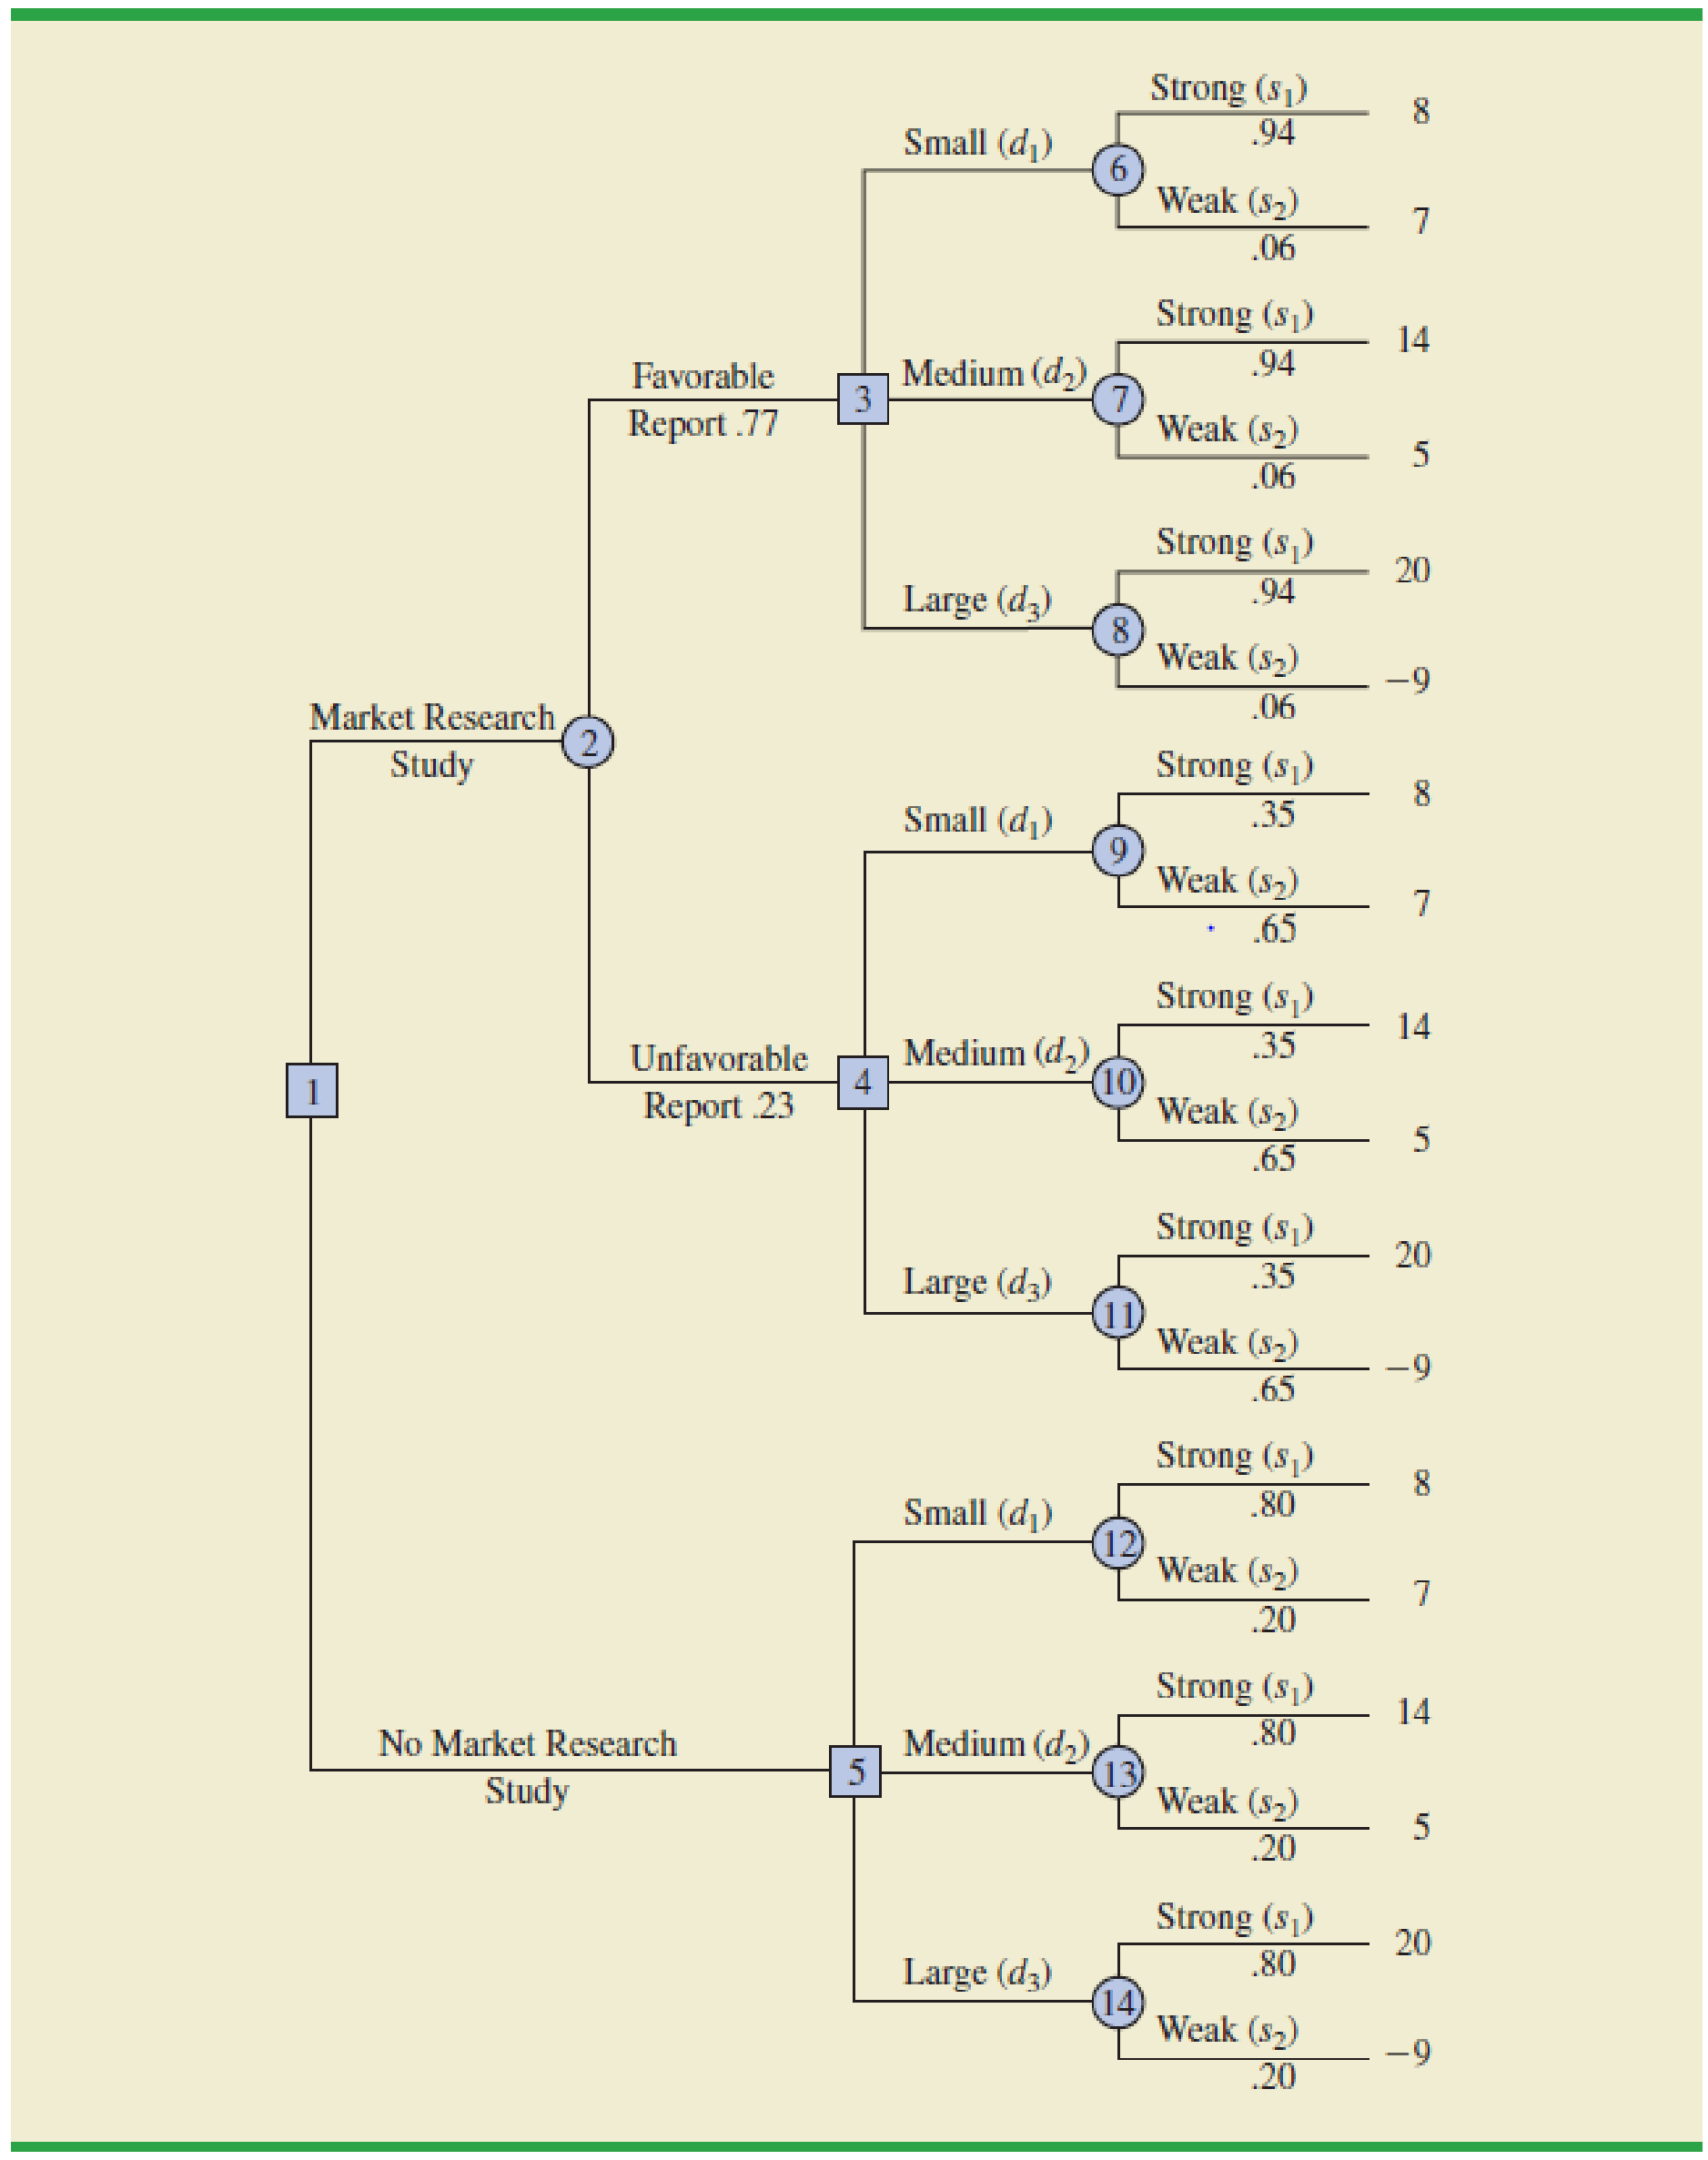
Consider a variation of the PDC decision tree shown in Figure 20.5. The company must first decide whether to undertake the market research study. If the market research study is conducted, the outcome will either be favourable (F) or unfavourable (U). Assume there are only two decision alternatives d1 and d2 and two states of nature s1 and s2. The payoff table showing profit is as follows:

a. Show the decision tree.
b. Use the following probabilities. What is the optimal decision strategy?
FIGURE 20.5 THE PDC DECISION TREE WITH BRANCH PROBABILITIES

Trending nowThis is a popular solution!

Chapter 20 Solutions
Modern Business Statistics with Microsoft Excel (MindTap Course List)


- The National Highway Association is studying the relationship between the number of bidders on a highway project and the winning (lowest) bid for the project. Of particular interest is whether the number of bidders increases or decreases the amount of the winning bid. Bidders Price 9.0 5.1 9.0 8.0 3.0 9.7 10.0 7.8 5.0 7.7 10.0 5.5 7.0 8.3 11.0 5.5 6.0 10.3 6.0 8.0 4.0 8.8 7.0 9.4 7.0 8.6 7.0 8.1 6.0 7.8 GIVEN: correlation coefficient: - 0.7064 Slope: -0.4667 Coefficient of determination: 49.90% regression equation: ŷ= 11.2360 + (-4467)x FIND: Estimate the winning bid if there were seven bidders. Winning bid cost _________ millions. Explain. Compute the 95% prediction interval for a winning bid if there are seven bidders. [ _______________ , _______________ ] (Explain).arrow_forwardWhat is the pure strategy Nash equilibrium outcome if there is one Is this a socially optimal outcome? If not, which outcome is preferredarrow_forwardThe Heinlein and Krampf Brokerage firm has just been instructed by one of its clients to invest $250,000 of her money obtained recently through the sale of land holdings in Ohio. The client has a good deal of trust in the investment house, but she also has her own ideas about the distribution of the funds being invested. In particular, she requests that the firm select whatever stocks and bonds they believe are well rated but within the following guidelines: Municipal bonds should constitute at least 20% of the investment. At least 40% of the funds should be placed in a combination of electronic firms, aerospace firms, and drug manufacturers. No more than 50% of the amount invested in municipal bonds should be placed in a high-risk, high-yield nursing home stock. Subject to these restraints, the client’s goal is to maximize projected return on investments. The analysts at Heinlein and Krampf, aware of these guidelines, prepare a list of high-quality stocks and bonds and their…arrow_forward
- n the book Business Research Methods (5th ed.), Donald R. Cooper and C. William Emory discuss a market researcher for an automaker who is studying consumer preferences for styling features of larger sedans. Buyers, who were classified as “first-time” buyers or “repeat” buyers, were asked to express their preference for one of two types of styling—European styling or Japanese styling. Of 40 first-time buyers, 11 preferred European styling and 29 preferred Japanese styling. Of 60 repeat buyers, 41 preferred European styling and 19 preferred Japanese styling. (a) Set up a contingency table for these data. (b) Test the hypothesis that buyer status (repeat versus first-time) and styling preference are independent at the .05 level of significance. What do you conclude? (Round your answer to 3 decimal places.)arrow_forwardAn article in a 2006 issue of Journal of Behavioral Decision Making reported on a study involving 47 undergraduate students in a class at Harvard. All of the participants were given $50, but some (randomly assigned) were told that this was a "tuition rebate", while the others were told that this was "bonus income". After one week, the students were contacted again and asked how much of the $50 they had spent and how much they had saved. Those in the "rebate" group had spent an average of $22.04 while those in the "bonus" group had spent an average of $9.55." (a) Did this study make use of random sampling, random assignment, both, or neither? Explain. (b) If the difference in average spending amounts between the two groups is determined to be statistically significant, would it be appropriate to draw a cause-and-effect conclusion in this case? Explain. (c) If the difference in average spending amounts between the two groups is determined to be statistically significant, would it be…arrow_forwardIn a survey, 175 consumers were asked about their buying preferences concerning a product that is sold in the market under three labels. The results were as follows. 13 buy only those sold under label A.24 buy only those sold under label B.25 buy only those sold under label C.13 buy only those sold under labels A and B.11 buy only those sold under labels A and C.14 buy only those sold under labels B and C.10 buy the product sold under all three labels.arrow_forward
- Consider the market depicted in the graph and assume the government imposes a price floor of P2. At P2, 150 units of the good are supplied (wish to be sold) and 50 units of the good are demanded (wish to be bought). Choose the correct ones: Without an enforcement mechanism, the effect of a binding price floor will be negligible because it will simply be ignored because buyers and sellers enrich themselves by trading below the floor price. With an enforcement mechanism, the effect of a binding price floor may still be negligible if the enforcement mechanism is easy to evade or doesn't impose a significant penalty for selling below the price floor. Without an enforcement mechanism, the effect of a binding price floor will be negligible because it will simply be ignored because buyers and sellers enrich themselves by trading above the floor price. With an enforcement mechanism, the effect of a binding price floor may still be negligible if the enforcement mechanism is easy to evade or…arrow_forwardIn a survey, 175 consumers were asked about their buying preferences concerning a product that is sold in the market under three labels. The results were as follows. 13 buy only those sold under label A.24 buy only those sold under label B.25 buy only those sold under label C.13 buy only those sold under labels A and B.11 buy only those sold under labels A and C.14 buy only those sold under labels B and C.10 buy the product sold under all three labels. How many of the consumers surveyed buy the product sold under (a) At least one of the three labels? consumers(b) Labels A and B but not C? consumers(c) Label A? consumers(d) None of these labels? consumersarrow_forwardAnswer the following questions based on the Strategy Region graph given below. When probability of high settlement is 12% and the probability of medium settlement is 40%, what is the optimal strategy? When probability of medium settlement is 20%, what is the highest probability of high settlement so that the Accept strategy to be optimal?arrow_forward
- In a study of the domestic market share of the three major automobile manufacturers A, B, and C in a certain country, it was found that their current market shares were 45%, 20%, and 35%, respectively. Furthermore, it was found that of the customers who bought a car manufactured by A, 75% would again buy a car manufactured by A, 15% would buy a car manufactured by B, and 10% would buy a car manufactured by C. Of the customers who bought a car manufactured by B, 90% would again buy a car manufactured by B, whereas 5% each would buy cars manufactured by A and C. Finally, of the customers who bought a car manufactured by C, 85% would again buy a car manufactured by C, 5% would buy a car manufactured by A, and 10% would buy a car manufactured by B. Assuming that these sentiments reflect the buying habits of customers in the future, determine the market share that will be held by each manufacturer after the next two model years. (Round your answers to the nearest percent.) A % B…arrow_forwardKroger is in the process of designing a new store to be located in a plaza under development in Mason. They intend to use their Symmes Township store as a model, but they are concerned that the customer base in Mason might have different needs and expectations. One area of concern is in Service Meats. Grocery shoppers in Symmes Township expect a Service Meat counter, and the department has been quite profitable. Kroger would like to know if the expectation of having a Service Meat counter will be the same in Mason as it is in Symmes Township. They survey residents of both areas, and among the questions is, "Do you buy meat from the Service Meat counter on a regular (weekly) basis?" In Symmes Township, 505 out of 780 respondents said YES. In Mason 325 out of 620 respondents said YES. Using a = .05, test the claim that the percentage of grocery shoppers who use Service Meats is the same in these two areas of the city.arrow_forwardIn a study of the domestic market share of the three major automobile manufacturers A, B, and C in a certain country, it was found that their current market shares were 65%, 10%, and 25%, respectively. Furthermore, it was found that of the customers who bought a car manufactured by A, 75% would again buy a car manufactured by A, 15% would buy a car manufactured by B, and 10% would buy a car manufactured by C. Of the customers who bought a car manufactured by B, 90% would again buy a car manufactured by B, whereas 5% each would buy cars manufactured by A and C. Finally, of the customers who bought a car manufactured by C, 85% would again buy a car manufactured by C, 5% would buy a car manufactured by A, and 10% would buy a car manufactured by B. Assuming that these sentiments reflect the buying habits of customers in the future, determine the market share that will be held by each manufacturer after the next two model years. (Round your answers to the nearest percent.)arrow_forward
 MATLAB: An Introduction with ApplicationsStatisticsISBN:9781119256830Author:Amos GilatPublisher:John Wiley & Sons Inc
 Probability and Statistics for Engineering and th...StatisticsISBN:9781305251809Author:Jay L. DevorePublisher:Cengage Learning
 Statistics for The Behavioral Sciences (MindTap C...StatisticsISBN:9781305504912Author:Frederick J Gravetter, Larry B. WallnauPublisher:Cengage Learning
 Elementary Statistics: Picturing the World (7th E...StatisticsISBN:9780134683416Author:Ron Larson, Betsy FarberPublisher:PEARSON
 The Basic Practice of StatisticsStatisticsISBN:9781319042578Author:David S. Moore, William I. Notz, Michael A. FlignerPublisher:W. H. Freeman
 Introduction to the Practice of StatisticsStatisticsISBN:9781319013387Author:David S. Moore, George P. McCabe, Bruce A. CraigPublisher:W. H. Freeman