
Using the information provided in problem F-3, illustrate Sue’s indifferent curve, with water on the horizontal axis and soft drinks on the vertical axis.
F-3 The table below represent Sue’s preferences for bottled water and soft drinks, the combination of which yields the same level of utility.
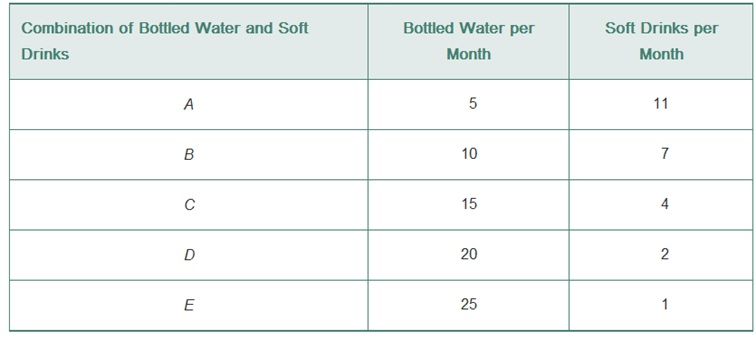
Calculate Sue’s marginal rate of substitution of soft drinks for bottled water at each rate of consumption of water (or soft drinks). Relate the marginal rate of substitution to
Content information:
Indifference curve represents combinations of goods that give the customers the same level of satisfaction. The consumers are indifferent to consumption of goods that fall on a given indifference curve.
Want to see the full answer?
Check out a sample textbook solution
Chapter 20 Solutions
MyLab Economics with Pearson eText -- Access Card -- for Economics Today: The Micro View


 Principles of Economics (12th Edition)EconomicsISBN:9780134078779Author:Karl E. Case, Ray C. Fair, Sharon E. OsterPublisher:PEARSON
 Engineering Economy (17th Edition)EconomicsISBN:9780134870069Author:William G. Sullivan, Elin M. Wicks, C. Patrick KoellingPublisher:PEARSON
 Principles of Economics (MindTap Course List)EconomicsISBN:9781305585126Author:N. Gregory MankiwPublisher:Cengage Learning
 Managerial Economics: A Problem Solving ApproachEconomicsISBN:9781337106665Author:Luke M. Froeb, Brian T. McCann, Michael R. Ward, Mike ShorPublisher:Cengage Learning
 Managerial Economics & Business Strategy (Mcgraw-...EconomicsISBN:9781259290619Author:Michael Baye, Jeff PrincePublisher:McGraw-Hill Education