
Illustrate Sue’s new budget constraint and indifferent curve in a diagram from the data in problem F-3, illustrate also the utility-maximizing combination of goods.
F-3 The table below represent Sue’s preferences for bottled water and soft drinks, the combination of which yields the same level of utility.
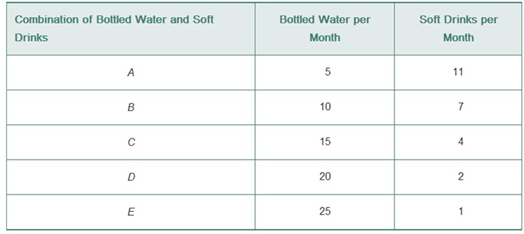
Calculate Sue’s marginal rate of substitution of soft drinks for bottled water at each rate of consumption of water (or soft drinks). Relate the marginal rate of substitution to
Content introduction:
Indifference curve:
It is a curve that connects points on a graph representing different quantities of two goods, points between which a consumer is indifferent. In other words, these points provide equal utility to the consumer.
Budget constraint:
It represents all combinations of goods that a consumer may purchase with his or her income. It is the first piece of the utility maximization framework.
Want to see the full answer?
Check out a sample textbook solution
Chapter 20 Solutions
Economics Today: The Micro View (19th Edition) (Pearson Series in Economics)


 Principles of Economics (12th Edition)EconomicsISBN:9780134078779Author:Karl E. Case, Ray C. Fair, Sharon E. OsterPublisher:PEARSON
 Engineering Economy (17th Edition)EconomicsISBN:9780134870069Author:William G. Sullivan, Elin M. Wicks, C. Patrick KoellingPublisher:PEARSON
 Principles of Economics (MindTap Course List)EconomicsISBN:9781305585126Author:N. Gregory MankiwPublisher:Cengage Learning
 Managerial Economics: A Problem Solving ApproachEconomicsISBN:9781337106665Author:Luke M. Froeb, Brian T. McCann, Michael R. Ward, Mike ShorPublisher:Cengage Learning
 Managerial Economics & Business Strategy (Mcgraw-...EconomicsISBN:9781259290619Author:Michael Baye, Jeff PrincePublisher:McGraw-Hill Education