
Videos
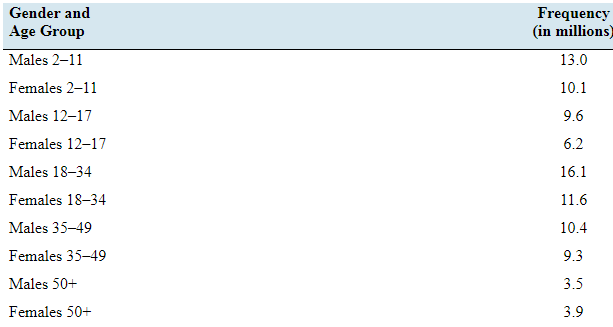
Ages of video garners: The Nielsen Company estimated the numbers of people in various gender and age categories who used a video game console. The results are presented in the following frequency distribution.
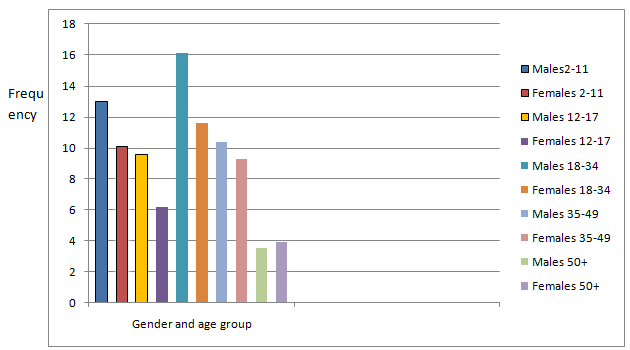
- Construct a frequency bar graph.
- Construct a relative frequency distribution.
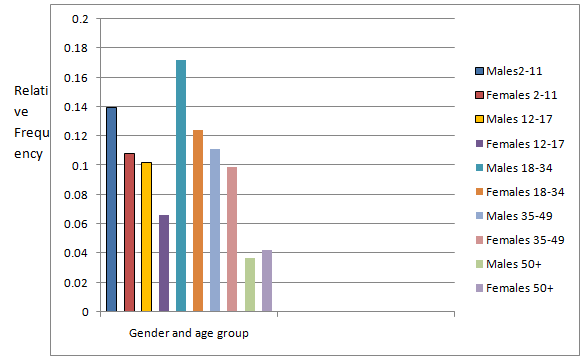
- Construct a relative frequency bar graph.
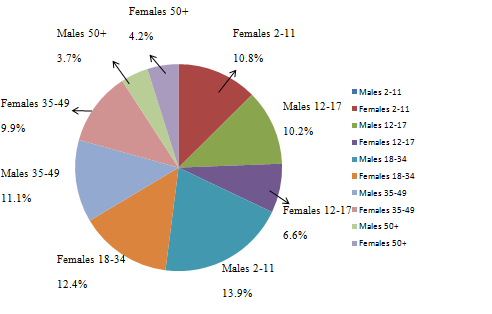
- Construct a pie chart.
- True or false: More than half of video garners are male.
- True or false: More than 40% of video garners are female.
- What proportion of video garners are 35 or over?
a.
To construct: A frequency bar graph.
Explanation of Solution
Given information: The Nielson Company estimated the numbers of people in various gender and age categories who used a video game console. The results are presented in the following frequency distribution.
| Gender and age group | Frequency (in millions) |
| Males 2-11 | 13.0 |
| Females 2-11 | 10.1 |
| Males 12-17 | 9.6 |
| Females 12-17 | 6.2 |
| Males 18-34 | 16.1 |
| Females 18-34 | 11.6 |
| Males 35-49 | 10.4 |
| Females 35-49 | 9.3 |
| Males 50+ | 3.5 |
| Females 50+ | 3.9 |
Solution:
From the given table, the frequency bar graph is given by
b.
To construct: The relative frequency distribution.
Explanation of Solution
Given information:The Nielson Company estimated the numbers of people in various gender and age categories who used a video game console. The results are presented in the following frequency distribution.
| Gender and age group | Frequency (in millions) |
| Males 2-11 | 13.0 |
| Females 2-11 | 10.1 |
| Males 12-17 | 9.6 |
| Females 12-17 | 6.2 |
| Males 18-34 | 16.1 |
| Females 18-34 | 11.6 |
| Males 35-49 | 10.4 |
| Females 35-49 | 9.3 |
| Males 50+ | 3.5 |
| Females 50+ | 3.9 |
Calculation:
From the given table,
The sum of all frequency is
The table of relative frequency is given by
| Gender and age group | Frequency (in millions) | Relative frequency |
| Males 2-11 | 13.0 | |
| Females 2-11 | 10.1 | |
| Males 12-17 | 9.6 | |
| Females 12-17 | 6.2 | |
| Males 18-34 | 16.1 | |
| Females 18-34 | 11.6 | |
| Males 35-49 | 10.4 | |
| Females 35-49 | 9.3 | |
| Males 50+ | 3.5 | |
| Females 50+ | 3.9 |
c.
To construct: A relative frequency bar graph.
Explanation of Solution
Given information:The Nielson Company estimated the numbers of people in various gender and age categories who used a video game console. The results are presented in the following frequency distribution.
| Gender and age group | Frequency (in millions) |
| Males 2-11 | 13.0 |
| Females 2-11 | 10.1 |
| Males 12-17 | 9.6 |
| Females 12-17 | 6.2 |
| Males 18-34 | 16.1 |
| Females 18-34 | 11.6 |
| Males 35-49 | 10.4 |
| Females 35-49 | 9.3 |
| Males 50+ | 3.5 |
| Females 50+ | 3.9 |
Definition used:
Histogram based on relative frequency is called relative frequency histogram.
Solution:
The Nielson Company estimated the numbers of people in various gender and age categories who used a video game console. The results are presented in the following frequency distribution.
| Gender and age group | Relative Frequency |
| Males 2-11 | 0.139 |
| Females 2-11 | 0.108 |
| Males 12-17 | 0.102 |
| Females 12-17 | 0.066 |
| Males 18-34 | 0.172 |
| Females 18-34 | 0.124 |
| Males 35-49 | 0.111 |
| Females 35-49 | 0.099 |
| Males 50+ | 0.037 |
| Females 50+ | 0.042 |
From the above table, the relative frequency bar graph is given by
d.
To construct: A pie chart
Explanation of Solution
Given information: The Nielson Company estimated the numbers of people in various gender and age categories who used a video game console. The results are presented in the following frequency distribution.
| Gender and age group | Frequency (in millions) |
| Males 2-11 | 13.0 |
| Females 2-11 | 10.1 |
| Males 12-17 | 9.6 |
| Females 12-17 | 6.2 |
| Males 18-34 | 16.1 |
| Females 18-34 | 11.6 |
| Males 35-49 | 10.4 |
| Females 35-49 | 9.3 |
| Males 50+ | 3.5 |
| Females 50+ | 3.9 |
Solution:
From the given table, the percentage of each gender and age group is given by
| Gender and age group | Relative Frequency | Percentage |
| Males 2-11 | 0.139 | 13.9% |
| Females 2-11 | 0.108 | 10.8% |
| Males 12-17 | 0.102 | 10.2% |
| Females 12-17 | 0.066 | 6.6% |
| Males 18-34 | 0.172 | 17.2% |
| Females 18-34 | 0.124 | 12.4% |
| Males 35-49 | 0.111 | 11.1% |
| Females 35-49 | 0.099 | 9.9% |
| Males 50+ | 0.037 | 3.7% |
| Females 50+ | 0.042 | 4.2% |
From the above table, the pie chart is given by
e.
True or False: More than half of video gamers are male.
Answer to Problem 25E
True.
Explanation of Solution
Given information:The Nielson Company estimated the numbers of people in various gender and age categories who used a video game console. The results are presented in the following frequency distribution.
| Gender and age group | Frequency (in millions) |
| Males 2-11 | 13.0 |
| Females 2-11 | 10.1 |
| Males 12-17 | 9.6 |
| Females 12-17 | 6.2 |
| Males 18-34 | 16.1 |
| Females 18-34 | 11.6 |
| Males 35-49 | 10.4 |
| Females 35-49 | 9.3 |
| Males 50+ | 3.5 |
| Females 50+ | 3.9 |
Solution:
The sum of all frequency is
The half of the frequency is 46.85.
The sum of total of male video gamer’s frequency is
Therefore, it is true that more than half of video gamers are male.
f.
True or False: More than 40% of video gamers are female.
Answer to Problem 25E
True.
Explanation of Solution
Given information:The Nielson Company estimated the numbers of people in various gender and age categories who used a video game console. The results are presented in the following frequency distribution.
| Gender and age group | Frequency (in millions) |
| Males 2-11 | 13.0 |
| Females 2-11 | 10.1 |
| Males 12-17 | 9.6 |
| Females 12-17 | 6.2 |
| Males 18-34 | 16.1 |
| Females 18-34 | 11.6 |
| Males 35-49 | 10.4 |
| Females 35-49 | 9.3 |
| Males 50+ | 3.5 |
| Females 50+ | 3.9 |
Solution:
The sum of all frequency is
40% of the total frequency is
The sum of total of female video gamer’s frequency is
Therefore, it is true that more than 40% of video gamers are female.
g.
To find: The proportion of video gamers is 35 or over.
Answer to Problem 25E
The proportion of video gamers is 35 or over is 0.289.
Explanation of Solution
Given information:The Nielson Company estimated the numbers of people in various gender and age categories who used a video game console. The results are presented in the following frequency distribution.
| Gender and age group | Frequency (in millions) |
| Males 2-11 | 13.0 |
| Females 2-11 | 10.1 |
| Males 12-17 | 9.6 |
| Females 12-17 | 6.2 |
| Males 18-34 | 16.1 |
| Females 18-34 | 11.6 |
| Males 35-49 | 10.4 |
| Females 35-49 | 9.3 |
| Males 50+ | 3.5 |
| Females 50+ | 3.9 |
Solution:
The sum of all frequency is
The sum of all frequency for which the video gamer is 35 or more is
The proportion of video gamers is 35 or over is given by
Therefore, the proportion of video gamers is 35 or over is 0.289.
Want to see more full solutions like this?
Chapter 2 Solutions
Loose Leaf Version For Elementary Statistics


 Glencoe Algebra 1, Student Edition, 9780079039897...AlgebraISBN:9780079039897Author:CarterPublisher:McGraw Hill
 Holt Mcdougal Larson Pre-algebra: Student Edition...AlgebraISBN:9780547587776Author:HOLT MCDOUGALPublisher:HOLT MCDOUGAL