
Videos
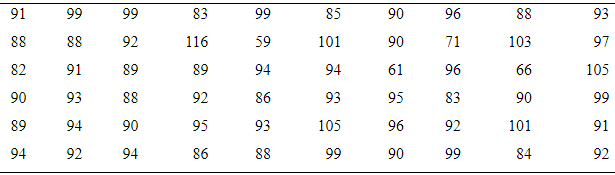
Geysers: The geyser Old Faithful in Yellowstone National Park alternates periods of eruption, which typically last from 1.5 to 4 minutes, with periods of dormancy, which are considerably longer. The following table presents the durations, in minutes, of 60 dormancy periods that occurred during a recent year.
- Construct a frequency distribution using a class width of 5, and using 55 as the lower class limit for the first class.
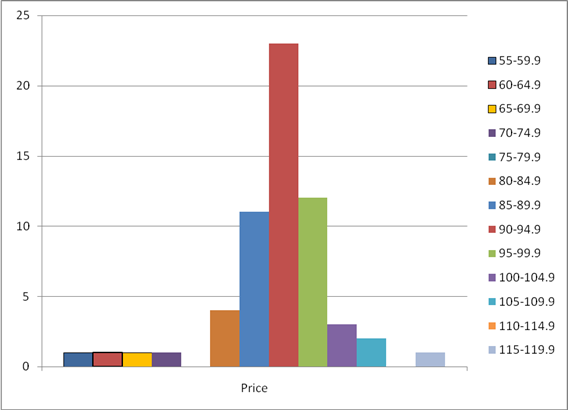
- Construct a frequency histogram from the frequency distribution in part (a).
- Construct a relative frequency distribution using the same class width and lower limit for the first class.
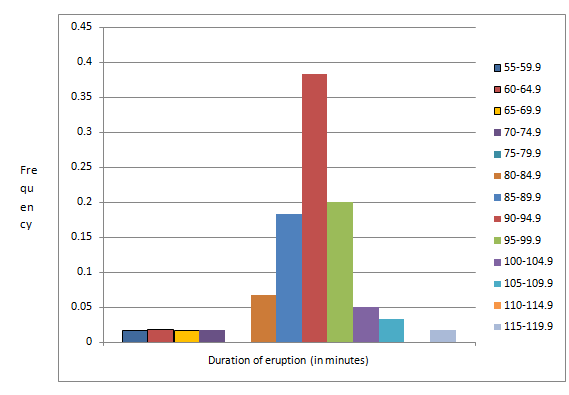
- Construct a relative frequency histogram.
- Are the histograms skewed to the left, skewed to the right, or approximately symmetric?
- Repeat parts (a)—(d), using a class width of 10, and using 50 as the lower class limit for the first class.
- Do you think that class widths of 5 and 10 are both reasonably good choices for these data, or do you think that one choice is much better than the other? Explain your reasoning.
a.
To construct:A frequency distribution using a class width of 5, and using 55 as the lower class limit for the first class.
Explanation of Solution
Given information:The following table presents the durations, in minutes, of 60 dormancy periods that occurred during a recent year.
| 91 | 99 | 99 | 83 | 99 | 85 | 90 | 96 | 88 | 93 |
| 88 | 88 | 92 | 116 | 59 | 101 | 90 | 71 | 103 | 97 |
| 82 | 91 | 89 | 89 | 94 | 94 | 61 | 96 | 66 | 105 |
| 90 | 93 | 88 | 92 | 86 | 93 | 95 | 83 | 90 | 99 |
| 89 | 94 | 90 | 95 | 93 | 105 | 96 | 92 | 101 | 91 |
| 94 | 92 | 94 | 86 | 88 | 99 | 90 | 99 | 84 | 92 |
Definition used: Frequency distributions for quantitative data are just like those for qualitative data, except the data are divided into classes rather categories.
Solution:
The class width is 5. The minimum and maximum values of the ratings are 55 and 119.9.
The table of frequency distribution is given by
| Dormancy period | Frequency |
| 55-59.9 | 1 |
| 60-64.9 | 1 |
| 65-69.9 | 1 |
| 70-74.9 | 1 |
| 75-79.9 | 0 |
| 80-84.9 | 4 |
| 85-89.9 | 11 |
| 90-94.9 | 23 |
| 95-99.9 | 12 |
| 100-104.9 | 3 |
| 105-109.9 | 2 |
| 110-114.9 | 0 |
| 115-119.9 | 1 |
b.
To construct:A frequency histogram from the frequency distribution.
Explanation of Solution
Given information:The table of frequency distribution is given by
| Dormancy period | Frequency |
| 55-59.9 | 1 |
| 60-64.9 | 1 |
| 65-69.9 | 1 |
| 70-74.9 | 1 |
| 75-79.9 | 0 |
| 80-84.9 | 4 |
| 85-89.9 | 11 |
| 90-94.9 | 23 |
| 95-99.9 | 12 |
| 100-104.9 | 3 |
| 105-109.9 | 2 |
| 110-114.9 | 0 |
| 115-119.9 | 1 |
Definition used: Histograms based on frequency distributions are called frequency histogram.
Solution:
The frequency histogram for the given data is given by
c.
To construct: A relative frequency distribution.
Explanation of Solution
Given information:The table of frequency distribution is given by
| Dormancy period | Frequency |
| 55-59.9 | 1 |
| 60-64.9 | 1 |
| 65-69.9 | 1 |
| 70-74.9 | 1 |
| 75-79.9 | 0 |
| 80-84.9 | 4 |
| 85-89.9 | 11 |
| 90-94.9 | 23 |
| 95-99.9 | 12 |
| 100-104.9 | 3 |
| 105-109.9 | 2 |
| 110-114.9 | 0 |
| 115-119.9 | 1 |
Formula used:
Solution:
From the given table,
The sum of all frequency is
The table of relative frequency is given by
| Dormancy period | Frequency | Relative frequency |
| 55-59.9 | 1 | |
| 60-64.9 | 1 | |
| 65-69.9 | 1 | |
| 70-74.9 | 1 | |
| 75-79.9 | 0 | |
| 80-84.9 | 4 | |
| 85-89.9 | 11 | |
| 90-94.9 | 23 | |
| 95-99.9 | 12 | |
| 100-104.9 | 3 | |
| 105-109.9 | 2 | |
| 110-114.9 | 0 | |
| 115-119.9 | 1 |
d.
To construct: A relative frequency histogram.
Explanation of Solution
Given information:The following table presents the durations, in minutes, of 60 dormancy periods that occurred during a recent year.
| 91 | 99 | 99 | 83 | 99 | 85 | 90 | 96 | 88 | 93 |
| 88 | 88 | 92 | 116 | 59 | 101 | 90 | 71 | 103 | 97 |
| 82 | 91 | 89 | 89 | 94 | 94 | 61 | 96 | 66 | 105 |
| 90 | 93 | 88 | 92 | 86 | 93 | 95 | 83 | 90 | 99 |
| 89 | 94 | 90 | 95 | 93 | 105 | 96 | 92 | 101 | 91 |
| 94 | 92 | 94 | 86 | 88 | 99 | 90 | 99 | 84 | 92 |
Definition used: Histograms based on relative frequency distributions are called relative frequency histogram.
Solution:
| Dormancy period | Relative frequency |
| 55-59.9 | 0.017 |
| 60-64.9 | 0.017 |
| 65-69.9 | 0.017 |
| 70-74.9 | 0.017 |
| 75-79.9 | 0.000 |
| 80-84.9 | 0.067 |
| 85-89.9 | 0.183 |
| 90-94.9 | 0.383 |
| 95-99.9 | 0.200 |
| 100-104.9 | 0.050 |
| 105-109.9 | 0.033 |
| 110-114.9 | 0.000 |
| 115-119.9 | 0.017 |
Therelative frequency histogram for the given data is given by
e.
To find: Whether the histograms are skewed to the right, skewed to the left , or approximately symmetric.
Answer to Problem 32E
The histogram is skewed to the left.
Explanation of Solution
Given information:The following table presents the durations, in minutes, of 60 dormancy periods that occurred during a recent year.
| 91 | 99 | 99 | 83 | 99 | 85 | 90 | 96 | 88 | 93 |
| 88 | 88 | 92 | 116 | 59 | 101 | 90 | 71 | 103 | 97 |
| 82 | 91 | 89 | 89 | 94 | 94 | 61 | 96 | 66 | 105 |
| 90 | 93 | 88 | 92 | 86 | 93 | 95 | 83 | 90 | 99 |
| 89 | 94 | 90 | 95 | 93 | 105 | 96 | 92 | 101 | 91 |
| 94 | 92 | 94 | 86 | 88 | 99 | 90 | 99 | 84 | 92 |
Definition used:
A histogram which has a long right-hand tail is said to be skewed to the right.
A histogram which has a long left-hand tail is said to be skewed to the left.
A histogram is symmetric if its right half is a minor image of its left half.
Solution:
The frequency histogram for the given data is given by
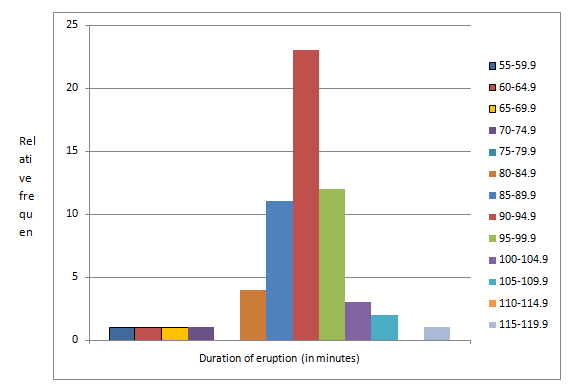
The above histogram has a long left-hand tail; therefore, it is skewed to the left.
Hence, the histogram is skewed to the left.
f.
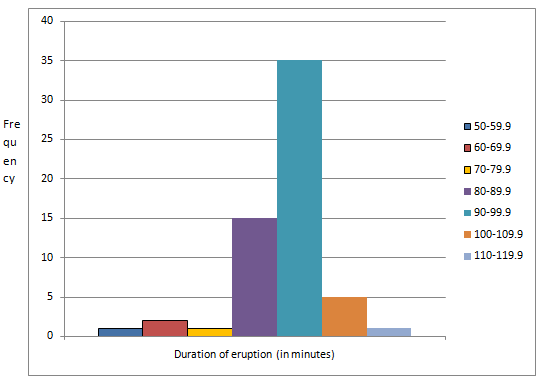
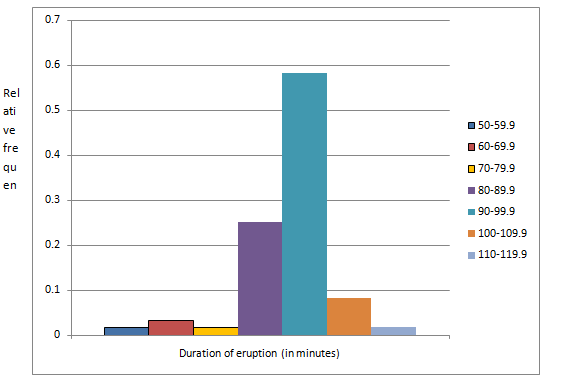
To construct: A frequency distribution using a class width of 10, and using 50 as the lower class limit for the first class, a frequency histogram, relative frequency distribution and relative frequency histogram.
Explanation of Solution
Given information: The following table presents the durations, in minutes, of 60 dormancy periods that occurred during a recent year.
| 91 | 99 | 99 | 83 | 99 | 85 | 90 | 96 | 88 | 93 |
| 88 | 88 | 92 | 116 | 59 | 101 | 90 | 71 | 103 | 97 |
| 82 | 91 | 89 | 89 | 94 | 94 | 61 | 96 | 66 | 105 |
| 90 | 93 | 88 | 92 | 86 | 93 | 95 | 83 | 90 | 99 |
| 89 | 94 | 90 | 95 | 93 | 105 | 96 | 92 | 101 | 91 |
| 94 | 92 | 94 | 86 | 88 | 99 | 90 | 99 | 84 | 92 |
Solution:
The class width is 10. The minimum and maximum values of the ratings are 50 and 119.9.
The table of frequency distribution is given by
| Dormancy period | Frequency |
| 50-59.9 | 1 |
| 60-69.9 | 2 |
| 70-79.9 | 1 |
| 80-89.9 | 15 |
| 90-99.9 | 35 |
| 100-109.9 | 5 |
| 110-119.9 | 1 |
The frequency histogram for the given data is given by
The sum of all frequency is
The relative frequency distribution table is given by
| Dormancy period | Frequency | Relative frequency |
| 50-59.9 | 1 | |
| 60-69.9 | 2 | |
| 70-79.9 | 1 | |
| 80-89.9 | 15 | |
| 90-99.9 | 35 | |
| 100-109.9 | 5 | |
| 110-119.9 | 1 |
The relative frequency histogram for the given data is given by
g.
To explain: Whether the good choices for the data are that class width of 5 or 10.
Answer to Problem 32E
Explanation of Solution
Given information:The following table presents the durations, in minutes, of 60 dormancy periods that occurred during a recent year.
| 91 | 99 | 99 | 83 | 99 | 85 | 90 | 96 | 88 | 93 |
| 88 | 88 | 92 | 116 | 59 | 101 | 90 | 71 | 103 | 97 |
| 82 | 91 | 89 | 89 | 94 | 94 | 61 | 96 | 66 | 105 |
| 90 | 93 | 88 | 92 | 86 | 93 | 95 | 83 | 90 | 99 |
| 89 | 94 | 90 | 95 | 93 | 105 | 96 | 92 | 101 | 91 |
| 94 | 92 | 94 | 86 | 88 | 99 | 90 | 99 | 84 | 92 |
The class width of 5 provides more appropriate level of detail in the middle of the histogram, but it is very sparse in the tail.
The class width of 10 is better in the tails, but most of the data are in only two classes.
Therefore, the distribution of class width of 5 is more reasonably good choice than class width of 10.
Want to see more full solutions like this?
Chapter 2 Solutions
Loose Leaf Version For Elementary Statistics


 Glencoe Algebra 1, Student Edition, 9780079039897...AlgebraISBN:9780079039897Author:CarterPublisher:McGraw Hill