
Concept explainers
Videos
Putting It Together: Online Homework Keeping students engaged in the learning process greatly increases their chance of success in a course. Traditional lecture-based math instruction has given way to a more student-engaged approach where students interact with the teacher in class and receive immediate feedback to their responses. The teacher presence allows students, when incorrect in a response, to be guided through a solution and then immediately be given a similar problem to attempt.
A researcher conducted a study to investigate whether an online homework system using an attempt–feedback–reattempt approach improved student learning over traditional pencil-and-paper homework. The online homework system was designed to increase student engagement outside class, something commonly missing in traditional pencil-and-paper assignments, ultimately leading to increased learning.
The study was conducted using two first-semester calculus classes taught by the researcher in a single semester. One class was assigned traditional homework and the other was assigned online homework that used the attempt–feedback–reattempt approach. The summaries are based on data from the study.
- a. What is the research objective?
- b. Is this study an observational study or experiment?
- c. Give an example of how the researcher attempted to control variables in the study.
- d. Explain why assigning homework type to entirely separate classes can confound the conclusions of the study.
- e. For the data in the table, (i) identify the variables, (ii) indicate whether the variables are qualitative or quantitative, and (iii) for each quantitative variable, indicate whether the variable is discrete or continuous.


Source: Journal of Computer in Mathematics and Science Teaching 26(1):55–73, 2007
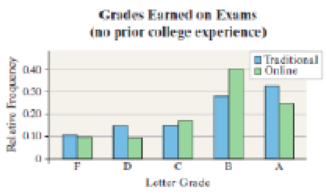
- f. What type of variable is letter grade? What level of measurement is letter grade? Do you think presenting the data in a table from A to F would be a better representation of the data than presenting it in a graph?
- g. What type of graph is displayed?
- h. Could the data in the graph be presented in a pie chart? If so, what is the “whole”? If not, why not?
- i. Considering the students with no prior college experience, how might the table and the graph generate conflicting conclusions?

Learn your wayIncludes step-by-step video

Chapter 2 Solutions
Fundamentals of Statistics (5th Edition)
Additional Math Textbook Solutions
Basic Business Statistics, Student Value Edition (13th Edition)
Essentials of Statistics, Books a la Carte Edition (5th Edition)
An Introduction to Mathematical Statistics and Its Applications (6th Edition)
Statistics for Psychology
Intro Stats, Books a la Carte Edition (5th Edition)
Elementary Statistics: Picturing the World (7th Edition)


- Cholesterol Cholesterol in human blood is necessary, but too much can lead to health problems. There are three main types of cholesterol: HDL (high-density lipoproteins), LDL (low-density lipoproteins), and VLDL (very low-density lipoproteins). HDL is considered “good” cholesterol; LDL and VLDL are considered “bad” cholesterol. A standard fasting cholesterol blood test measures total cholesterol, HDL cholesterol, and triglycerides. These numbers are used to estimate LDL and VLDL, which are difficult to measure directly. Your doctor recommends that your combined LDL/VLDL cholesterol level be less than 130 milligrams per deciliter, your HDL cholesterol level be at least 60 milligrams per deciliter, and your total cholesterol level be no more than 200 milligrams per deciliter. (a) Write a system of linear inequalities for the recommended cholesterol levels. Let x represent the HDL cholesterol level, and let y represent the combined LDL VLDL cholesterol level. (b) Graph the system of inequalities from part (a). Label any vertices of the solution region. (c) Is the following set of cholesterol levels within the recommendations? Explain. LDL/VLDL: 120 milligrams per deciliter HDL: 90 milligrams per deciliter Total: 210 milligrams per deciliter (d) Give an example of cholesterol levels in which the LDL/VLDL cholesterol level is too high but the HDL cholesterol level is acceptable. (e) Another recommendation is that the ratio of total cholesterol to HDL cholesterol be less than 4 (that is, less than 4 to 1). Identify a point in the solution region from part (b) that meets this recommendation, and explain why it meets the recommendation.arrow_forwardPopulation Genetics In the study of population genetics, an important measure of inbreeding is the proportion of homozygous genotypesthat is, instances in which the two alleles carried at a particular site on an individuals chromosomes are both the same. For population in which blood-related individual mate, them is a higher than expected frequency of homozygous individuals. Examples of such populations include endangered or rare species, selectively bred breeds, and isolated populations. in general. the frequency of homozygous children from mating of blood-related parents is greater than that for children from unrelated parents Measured over a large number of generations, the proportion of heterozygous genotypesthat is, nonhomozygous genotypeschanges by a constant factor 1 from generation to generation. The factor 1 is a number between 0 and 1. If 1=0.75, for example then the proportion of heterozygous individuals in the population decreases by 25 in each generation In this case, after 10 generations, the proportion of heterozygous individuals in the population decreases by 94.37, since 0.7510=0.0563, or 5.63. In other words, 94.37 of the population is homozygous. For specific types of matings, the proportion of heterozygous genotypes can be related to that of previous generations and is found from an equation. For mating between siblings 1 can be determined as the largest value of for which 2=12+14. This equation comes from carefully accounting for the genotypes for the present generation the 2 term in terms of those previous two generations represented by for the parents generation and by the constant term of the grandparents generation. a Find both solutions to the quadratic equation above and identify which is 1 use a horizontal span of 1 to 1 in this exercise and the following exercise. b After 5 generations, what proportion of the population will be homozygous? c After 20 generations, what proportion of the population will be homozygous?arrow_forward

 Functions and Change: A Modeling Approach to Coll...AlgebraISBN:9781337111348Author:Bruce Crauder, Benny Evans, Alan NoellPublisher:Cengage Learning
 Big Ideas Math A Bridge To Success Algebra 1: Stu...AlgebraISBN:9781680331141Author:HOUGHTON MIFFLIN HARCOURTPublisher:Houghton Mifflin Harcourt