
Concept explainers
Videos
Grade Inflation. The bar graph shows the percentage of U.S. college freshmen with an average grade of A in high school.
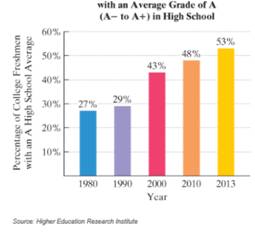
The data displayed by the bar graph can be described by the mathematical model
65.
a. According to the formula, in 2010, what percentage of U.S. college freshmen had an average grade of A in high school? Does this underestimate or overestimate the percent displayed by the bar graph? By how much?
b. Use the formula to project the percentage of U.S. college freshmen in 2020 who will have had an average grade of A in high school.
Want to see the full answer?
Check out a sample textbook solution
Chapter 2 Solutions
Introductory Algebra for College Students (7th Edition)


 College AlgebraAlgebraISBN:9781305115545Author:James Stewart, Lothar Redlin, Saleem WatsonPublisher:Cengage Learning
 Algebra and Trigonometry (MindTap Course List)AlgebraISBN:9781305071742Author:James Stewart, Lothar Redlin, Saleem WatsonPublisher:Cengage Learning
 Algebra & Trigonometry with Analytic GeometryAlgebraISBN:9781133382119Author:SwokowskiPublisher:Cengage
 Glencoe Algebra 1, Student Edition, 9780079039897...AlgebraISBN:9780079039897Author:CarterPublisher:McGraw Hill
 Algebra for College StudentsAlgebraISBN:9781285195780Author:Jerome E. Kaufmann, Karen L. SchwittersPublisher:Cengage Learning