
Videos
The Corruption perceptions Index uses perceptions of the general public, business people, and risk analysts to rate countries by how likely they are to accept bribes. The ratings are on a scale from 0 to 10, where higher scores represent less corruption. The graph shows the corruption ratings for the world's least corrupt and most corrupt countries. (The rating for United States is 7.6.) Use the graph to solve Exercises 99-100.
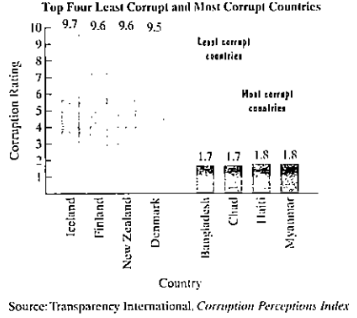
a. Write a set of four ordered pairs in which each of the least corrupt countries corresponds to a corruptions rating. Each ordered pair should be in the form (country, corruption rating).
b. Is the relation in part (a) a function? Explain your answer.
c. Write a set of four ordered pairs in which corruption ratings for the least corrupt countries correspond to countries. Each ordered pair should be in the form (corruption rating, country).
d. Is the relation in part (c) a function? Explain your answer.
Want to see the full answer?
Check out a sample textbook solution
Chapter 2 Solutions
College Algebra, Books a la Carte Edition Plus NEW MyLab Math -- Access Card Package (7th Edition)


- Salary after College. In 2010, MonsterCollege surveyed 1250 U.S.college students expecting to graduate in the next several years. Respondents were asked the following question: What do you think your starting salary will be at your first job after college? The line graph shows the percentage of college students who anticipated various starting salaries. Then Solve; What starting salaries were anticipated by more than 20% of college students?arrow_forwardBased on the line graph shown, how did Google's stock price perform between September 2015 and December 2015? a) The stock price did not change b) The stock price decreased c) The stock price increased d) Not enough information to determine the stock price performancearrow_forwardUse CER, claim (answer), evidence (graph), reasoning (why is this true).arrow_forward
- The coaches of a group of debate teams answered a survey about hours of debate team practice and number of team wins. The graph shows the results of this survey. Based on these results, if a team practices 4 hours per week next season, which is the best estimate of the number of debates the team can expect to win? 1 12 16 20arrow_forwardUse graph to answer a,b,c,d,earrow_forwardThe coaches of a group of debate teams answered a survey about hours of debate and number of team wins. The graph shows the result of the survey. Based on these results if a team practices 6 hours per week next season, which is the best estimate of the number of debates the team can expect to win? 1 24 2 20arrow_forward
 Algebra: Structure And Method, Book 1AlgebraISBN:9780395977224Author:Richard G. Brown, Mary P. Dolciani, Robert H. Sorgenfrey, William L. ColePublisher:McDougal Littell
 Holt Mcdougal Larson Pre-algebra: Student Edition...AlgebraISBN:9780547587776Author:HOLT MCDOUGALPublisher:HOLT MCDOUGAL
 Big Ideas Math A Bridge To Success Algebra 1: Stu...AlgebraISBN:9781680331141Author:HOUGHTON MIFFLIN HARCOURTPublisher:Houghton Mifflin Harcourt