Concept explainers
Videos
(a)
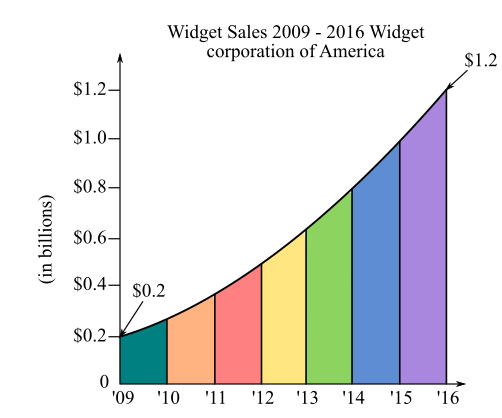
The amount of widget sales in the year
(b)
The year when widget sales reach
(c)
The representation of line graph given below,
(d)
The variables that are represented on the x-axis and y-axis of the line chart “widget sales
(e)
The amount of widget sales in the year
(f)
The year when widget sales reached
(g)
To calculate: The comparison between the widget sales of

Trending nowThis is a popular solution!

Chapter 21 Solutions
Contemporary Mathematics for Business and Consumers


- A researcher is interested in graphing the relationship between amount of debt (mild, moderate, severe) and number of employees. Which is the most appropriate graphical display that would be used to graph this relationship? A. mosaic plot B. histogram C. scatterplot D. side-by-side boxplots E. Pareto chartarrow_forward3. A student asks her friends how much they make per hour. The values are $15.00, $15.00, $18.00, $16.50, $23.00, $17.50 Calculate the average, median, and SD of these values. Average = $ Median = $ SD = $arrow_forwardUse the average annual consumer price index table to convert the 1978 minimum wage from actual dollars to 1996 dollars. Is the result consistent with the entry in the accompanying minimum wage table? Click the icon to view the table of federal minimum wages. The 1978 minimum wage in 1996 dollars is $. (Round to the nearest cent as needed.) Federal Minimum Wages Year 1938 1939 1945 1950 1990 1956 1961 1967 1968 pe 1974 1976 1978 1979 1981 1990 1991 1996 1997 2007 2008 2009 Actual Dollars 1996 Dollars $2.78 $3.39 $3.49 $0.25 $0.30 $0.40 $0.75 90.19 $1.00 $1.25 $1.40 91.00 $1.60 $2.00 22:00 $2.30 $2.50 $2.65 22.0 $2.90 222 $3.35 $3.50 $4.25 $4.75 $5.15 $5.85 $6.55 $7.25 $4.88 67.90 $5.77 $6.41 20.70 $6.58 $7.21 66.27 $6.37 20:37 $6.34 20:20 $6.38 20:30 $6.27 90:20 $5.78 $4.56 $4.90 $4.75 $5.03 $4.42 $4.77 $5.12 - X Average Annual Consumer Price Index (CPI) (1982-1984 = 100) Year CPI Year CPI Year CPI 1976 56.9 1989 124.0 2001 177.1 1977 60.6 1990 130.7 2002 179.9 1978 65.2 1991 136.2 2003…arrow_forward
- The table below shows a recent graduate's credit card balance each month after graduation. Month 1 2 3 Debt ($) 620.00 761.88 899.80 a) Look at the graph on your calculator. Based on this graph, what type of equation should represent this situation? Explain your answer. b) Use your calculator to find the equation that you feel best fits this data. What is the equation? c) Based on this equation, what is the predicted amount of debt for month 9 after graduation?arrow_forwardBelow we list several variables. Which of these variables are quantitative, and which are qualitative?arrow_forwardIn 2014, the median salary nationwide for a high school teacher was $56,310 per year. The median annual wage for all workers was $35,540.SOURCE: United States. Department of Labor. "High School Teachers." Occupational Outlook Handbook. 17 Dec. 2015. Web. 7 March 2016. Suppose a worker makes $29,000 in wages per year. Find the percent increase in salary the worker can expect if he/she trains to be a teacher and can expect to earn a salary of $40,000. Enter your response to the nearest 0.1% %arrow_forward
- Housing expenses are an important part of a personal budget. Use the internet to researchwhat percent of a household’s monthly income should be used for housing. If the medianhousehold income in Volusia county is $3500 per month, answer the following questions.9. a. What percent of household income should be used for housing?b. Could a typical Volusia county household afford the home with the 15-yearmortgage? Why or why not?c. Could a typical Volusia county household afford the home with the 30-year mortgage?Why or why not?arrow_forward7. In 2011 there were about $3.5 billion in sales of organic goods in America. In 2016 this increased to $7.8 billion. Which of the following correctly describe the change... Pick all that apply. a. 123 % increase b. growth of $4.3 billion c. 223 % increase d. 23 % increase e. change of $4.3arrow_forwarda. Complete the rate table. Number of Peppers 1 15 20 100 4 10 Cost 2.25 b. How many peppers could you buy for $20? c. Describe what the graph of this data would look like and name a point on the graph.arrow_forward
- In the last three years, there have been changes of 55%, 3% and 2% in the production amount of a good, respectively. What is the geometric mean of the annual rate of change?arrow_forwardThe following information on maintenance and repair costs and revenues for the last two years is available from the accounting records at Arnie’s Arcade & Video Palace. Arnie has asked you to help him understand the relation between business volume and maintenance and repair cost. Month Maintenance and Repair Cost ($000) Revenues ($000) July $2.31 $59.00 August 3.28 53.00 September 2.80 49.00 October 2.21 65.00 November 2.30 77.00 December 1.14 105.00 January 3.12 45.00 February 3.16 51.00 March 3.02 61.00 April 2.98 63.00 May 2.04 67.00 June 1.78 79.00 July 2.60 73.00 August 2.02 67.00 September 2.57 75.00 October 2.38 77.00 November 1.43 87.00 December 0.76 117.00 January 2.58 61.00 February 2.28 63.00 March 1.69 83.00 April 1.95 87.00 May 1.95 73.00 June 1.33 69.00 Required: Using Excel, estimate a linear regression with maintenance and repair cost as the dependent variable and revenue as the independent variable.…arrow_forwardA. By how much does the machine decrease in value (in dollars) in 1 year? B. Predict when (in years) the value of the copy machine will be zero.arrow_forward
 Holt Mcdougal Larson Pre-algebra: Student Edition...AlgebraISBN:9780547587776Author:HOLT MCDOUGALPublisher:HOLT MCDOUGAL
 Algebra: Structure And Method, Book 1AlgebraISBN:9780395977224Author:Richard G. Brown, Mary P. Dolciani, Robert H. Sorgenfrey, William L. ColePublisher:McDougal Littell