Contemporary Mathematics for Business and Consumers
7th Edition
ISBN: 9781285189758
Author: Robert Brechner, George Bergeman
Publisher: Cengage Learning
expand_more
expand_more
format_list_bulleted
Videos
Textbook Question
Chapter 21.I, Problem 8RE
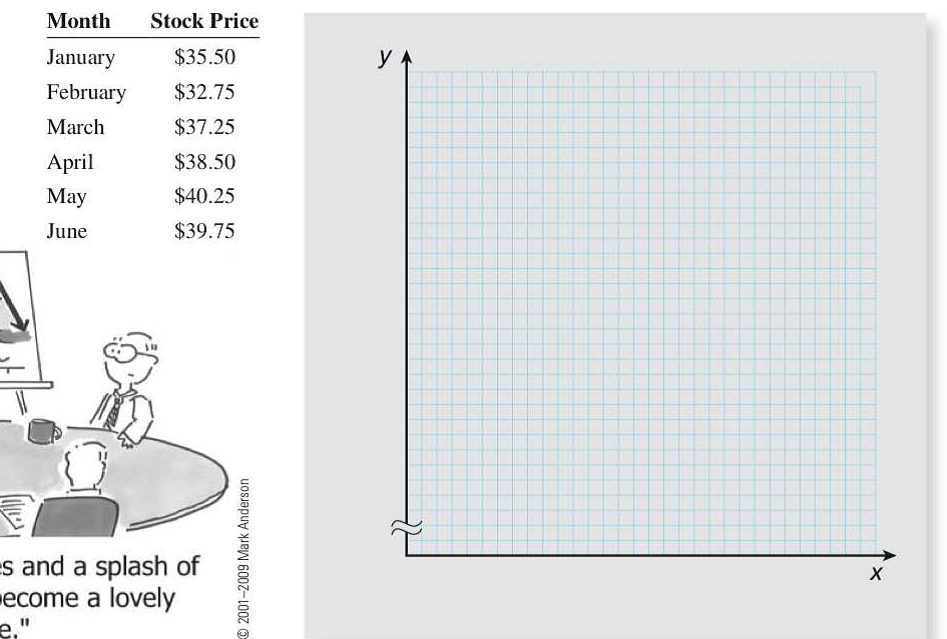
BUSINESS DECISION: CHOOSING A CHART
You have been asked to prepare a chart of stock prices for the upcoming semiannual stockholders' meeting for Magnum Enterprises. The following table shows Magnum's stock prices on the first day of each month Choose and prepare a chart that best illustrates this information.
Expert Solution & Answer
Want to see the full answer?
Check out a sample textbook solution
Students have asked these similar questions
please help me with this
For the given set of business data, (a) identify the appropriate graph/chart to use, (b)
draw the graph/chart to present the data, and (c) analyze and interpret the data presented
in the graph/chart.
1. Sales of your business for one week
Sales
Day
(in thousand pesos)
Monday
40
45
Tuesday
50
Wednesday
60
Thursday
90
Friday
80
Saturday
70
Sunday
Day traders typically buy and sell stocks (or other investment instruments) during the trading day and sell all investments by the
end of the day. The following table shows the closing prices on September 22, 2015, of 12 stocks selected by your broker,
Prudence Swift, as well as the change that day.
Tech Stocks
Close
Change
AAPL (Apple)
$113.40
-1.81
ADBE (Adobe Systems)
$84.66
1.34
EBAY (eBay)
$25.61
-0.31
MSFT (Microsoft)
$3.90
-0.21
S (Sprint)
$4.40
0.02
WIFI (Boingo Wireless)
$8.51
0.56
Non-Tech Stocks
ANF (Abercrombie & Fitch)
$21.81
-0.02
в (Воeing)
$133.99
-2.03
F (Ford Motor Co.)
$13.91
-0.40
GE (General Electric)
$25.10
0.01
GIS (General Mills)
$57.12
0.33
JNJ (Johnson & Johnson)
$93.26
0.13
On the morning of September 22, 2015, Swift advised you to purchase a collection of three tech stocks and two non-tech stocks,
all chosen at random from those listed in the table. You were to sell all the stocks at the end of the trading day.
(a) How many possible collections are possible?…
Chapter 21 Solutions
Contemporary Mathematics for Business and Consumers
Ch. 21.I - Use Table 21-1 to answer the following questions...Ch. 21.I - Use Exhibits 21-1 and 21-2 to answer the following...Ch. 21.I - Prob. 3TIECh. 21.I - Prob. 4TIECh. 21.I - Prob. 5TIECh. 21.I - Prob. 6TIECh. 21.I - Prob. 7TIECh. 21.I - Prob. 8TIECh. 21.I - Prob. 9TIECh. 21.I - Prob. 10TIE
Ch. 21.I - Prob. 1RECh. 21.I - TABLE 21-1 Magnum Enterprises Six-Month Sales...Ch. 21.I - Prob. 3RECh. 21.I - Prob. 4RECh. 21.I - TABLE 21-1 Magnum Enterprises Six-Month Sales...Ch. 21.I - Prob. 6RECh. 21.I - Prob. 7RECh. 21.I - BUSINESS DECISION: CHOOSING A CHART
8. You have...Ch. 21.II - Prob. 11TIECh. 21.II - Prob. 12TIECh. 21.II - Prob. 13TIECh. 21.II - Prob. 14TIECh. 21.II - Prob. 15TIECh. 21.II - Prob. 1RECh. 21.II - Prob. 2RECh. 21.II - Prob. 3RECh. 21.II - Prob. 4RECh. 21.II - Prob. 5RECh. 21.II - Prob. 6RECh. 21.II - Prob. 7RECh. 21.II - Prob. 8RECh. 21.II - Prob. 9RECh. 21.II - Prob. 10RECh. 21.II - Determine the mode of the following sets of...Ch. 21.II - Prob. 12RECh. 21.II - Prob. 13RECh. 21.II - Prob. 14RECh. 21.II - Prob. 15RECh. 21.II - Prob. 16RECh. 21.II - Prob. 17RECh. 21.II - The following numbers represent the gallons of...Ch. 21.II - You are the owner of The Dependable Delivery...Ch. 21.II - Prob. 20RECh. 21.III - Prob. 17TIECh. 21.III - Prob. 18TIECh. 21.III - Prob. 1RECh. 21.III - You are the sales manager of the Esquire...Ch. 21.III - Prob. 3RECh. 21.III - BUSINESS DECISION: RELATIVE FREQUENCY...Ch. 21 - 1. The systematic process of collecting,...Ch. 21 - 2. Statistical procedures that deal with the...Ch. 21 - A collection of related data arranged for ease of...Ch. 21 - Prob. 4CRCh. 21 - 5. The horizontal axis of a line chart is known as...Ch. 21 - Prob. 6CRCh. 21 - To construct a pie chart, we multiply each...Ch. 21 - Prob. 8CRCh. 21 - 9. The _______ is the midpoint value of a set of...Ch. 21 - Prob. 10CRCh. 21 - Prob. 11CRCh. 21 - Prob. 12CRCh. 21 - Prob. 13CRCh. 21 - Prob. 14CRCh. 21 - 1. The following data represent the monthly sales...Ch. 21 - Prob. 2ATCh. 21 - Prob. 3ATCh. 21 - You have just been hired as the quality control...Ch. 21 - 5. You are the human resource director for Apollo...
Knowledge Booster


Learn more about
Need a deep-dive on the concept behind this application? Look no further. Learn more about this topic, subject and related others by exploring similar questions and additional content below.Similar questions
- The stacked column graph below shows additional information from the Bureau of Labor Statistics¹ about employment and education for two groups of workers in the United States compared with the graph discussed in the in-class activity. This graph includes data about workers aged 65 and older. Percentage Employment distribution of workers by education 1997 and 2007 2007 Age 65 and older Pocholode higher's degree. college or associate graduates college mless than a high school. diploma Part A: Use the graph to estimate the following information for the Age 65 and older group and complete the following table. 2007 Age 65 and older 1997 % % % % % % Bachelor's degree or higher Some college or associate degree High school graduates, no college % % Less than a high school diploma % AP % Totalarrow_forwardTraveltime Tours has a defined benefit pension plan. As a new employee, you are interested in the future well-being of the plan. To help you visualize your assessment, you use your Excel skills to graph the key numbers. The line graph below plots the balances of the company's Projected Benefit Obligation and its Plan Assets over the most recent six years. BALANCES DEFINED BENEFIT PENSION PLAN →→→Pension Plan Assets →→Projected Benefit Obligation $35,000 $30,000 $25,000 $20.000 $15,000 $10,000 $5,000 $0 1 2 3 YEAR 4 5 Click here to open the graph(s) in a new tab. Required: 1. What was the funded status of Traveltime's pension plan in Year 2? 2. In which years did Traveltime report a Net Pension Liability? 3. In which years was Traveltime's pension plan overfunded? 4. What might have been the primary reason for the pension plan becoming overfunded? 6arrow_forwardNo.explanation requiredarrow_forward
- draw a line graph following this information. The line graph depicts the historical and projected sales volume of Pepsi Co Jamaica's Diet Pepsi for the next fiscal year, with the horizontal axis representing the four quarters of the year, and the vertical axis representing the sales volume in million cases. The historical sales data is represented by a line that shows a sales volume of 1 million cases for the past fiscal year. The projected sales volume is represented by another line that shows an expected increase in sales volume to 1.5 million cases for the next fiscal year. The sales targets for each quarter are represented by markers or points on the graph, with the first quarter expected to reach 0.4 million cases, the second quarter at 0.5 million cases, the third quarter at 0.3 million cases, and the fourth quarter at 0.3 million cases.arrow_forwardNo.explanation requiredarrow_forwardA retail store accepts cash, check, credit card, and debit cards for purchases. The store owner wants to produce a visualization showing the proportion of purchases made by these payment methods in the last year. What would be the most appropriate graph to visualize this? Stem and Leaf Plot Histogram Pie chart Scatter Plotarrow_forward
- The graph to the right shows total assets and total liabilities for a certain company in billions of dollars. Complete parts (a) through (c) below. 300 ... 250- (a) Shareholders' equity is a corporation's total assets minus total liabilities. Estimate the company's shareholders' equity in the year 2015. 200 Assets The equity is $ billion. 150- (Round to the nearest ten as needed.) 100- Liabilities 50 0- 2011 2012 2013 Year 2015 2014 Help Me Solve This View an Example Get More Help - Clear All Che arch ...* Assets and Liabilities (billions of dollars)arrow_forwardFind an example of a Health or Medicine bar graph and a histogram arising from data in that area. For your example, use the bar graph and the histogram to explain what the data being represented is for the bar graph and the histogram.arrow_forwardClassification of Data Identify the individuals and give the variables under the following: 1. You want to study about the people who climbed Mt. Everest. 2. The Department of Agriculture wishes to conduct a study about the pineapples in Tagaytay.arrow_forward
- Please help, I’m stuck on this question, thank you so so much!!arrow_forwardUse the accompanying data table regarding retirement funds. Complete parts (a) through (d) below. a. Construct a growth and value table that tabulates type, market cap, risk,and rating.arrow_forwardUse the graph below, which shows the average number of weekly viewers of a 30- minute television program (in millions of viewers) from 2000 to 2006. milions of viewers 30 25- ខ 15- 10- 5 2000 2001 2002 2003 2004 2005 2006 year Select one: a. (2001, 2004, 2006} b. (2002, 2003, 2005} c. {1001, 2002, 2005} d. {2004}arrow_forward
arrow_back_ios
SEE MORE QUESTIONS
arrow_forward_ios
Recommended textbooks for you
 Discrete Mathematics and Its Applications ( 8th I...MathISBN:9781259676512Author:Kenneth H RosenPublisher:McGraw-Hill Education
 Mathematics for Elementary Teachers with Activiti...MathISBN:9780134392790Author:Beckmann, SybillaPublisher:PEARSON
 Thinking Mathematically (7th Edition)MathISBN:9780134683713Author:Robert F. BlitzerPublisher:PEARSON
 Discrete Mathematics With ApplicationsMathISBN:9781337694193Author:EPP, Susanna S.Publisher:Cengage Learning,
 Pathways To Math Literacy (looseleaf)MathISBN:9781259985607Author:David Sobecki Professor, Brian A. MercerPublisher:McGraw-Hill Education
Discrete Mathematics and Its Applications ( 8th I...
Math
ISBN:9781259676512
Author:Kenneth H Rosen
Publisher:McGraw-Hill Education
Mathematics for Elementary Teachers with Activiti...
Math
ISBN:9780134392790
Author:Beckmann, Sybilla
Publisher:PEARSON
Thinking Mathematically (7th Edition)
Math
ISBN:9780134683713
Author:Robert F. Blitzer
Publisher:PEARSON
Discrete Mathematics With Applications
Math
ISBN:9781337694193
Author:EPP, Susanna S.
Publisher:Cengage Learning,
Pathways To Math Literacy (looseleaf)
Math
ISBN:9781259985607
Author:David Sobecki Professor, Brian A. Mercer
Publisher:McGraw-Hill Education
Introduction to Statistical Quality Control (SQC); Author: FORSEdu;https://www.youtube.com/watch?v=c18FKHUDZv8;License: Standard YouTube License, CC-BY
[DAXX] Introduction to Statistical Quality Control; Author: The Academician;https://www.youtube.com/watch?v=ypZGDxjSM60;License: Standard Youtube License