Concept explainers
Videos
(a)
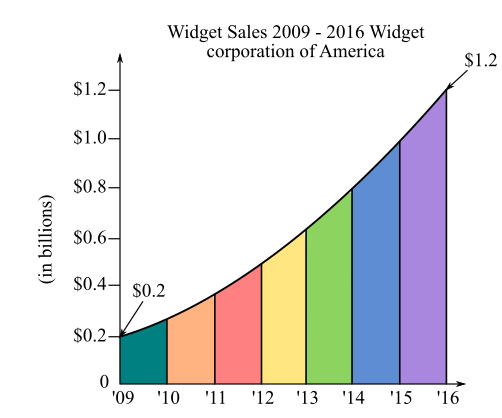
The amount of widget sales in the year
(b)
The year when widget sales reach
(c)
The representation of line graph given below,
(d)
The variables that are represented on the x-axis and y-axis of the line chart “widget sales
(e)
The amount of widget sales in the year
(f)
The year when widget sales reached
(g)
To calculate: The comparison between the widget sales of

Trending nowThis is a popular solution!

Chapter 21 Solutions
EBK CONTEMPORARY MATHEMATICS FOR BUSINE


- Find the mean hourly cost when the cell phone described above is used for 240 minutes.arrow_forwardStock Market During the week of June 22, 2009, the closing numbers of the Dow Jones Industrial Average each day were: What was the overall change for the week? Was it positive or negative?arrow_forward
 Elementary AlgebraAlgebraISBN:9780998625713Author:Lynn Marecek, MaryAnne Anthony-SmithPublisher:OpenStax - Rice University
 Holt Mcdougal Larson Pre-algebra: Student Edition...AlgebraISBN:9780547587776Author:HOLT MCDOUGALPublisher:HOLT MCDOUGAL
 Algebra: Structure And Method, Book 1AlgebraISBN:9780395977224Author:Richard G. Brown, Mary P. Dolciani, Robert H. Sorgenfrey, William L. ColePublisher:McDougal Littell
 College Algebra (MindTap Course List)AlgebraISBN:9781305652231Author:R. David Gustafson, Jeff HughesPublisher:Cengage Learning