
18 WEEK MY MATHLAB
null Edition
ISBN: 9780135909249
Author: HARSHBARGER
Publisher: PEARSON
expand_more
expand_more
format_list_bulleted
Concept explainers
Videos
Textbook Question
Chapter 2.2, Problem 13E
Use the data in the following table for Exercises 11–14.
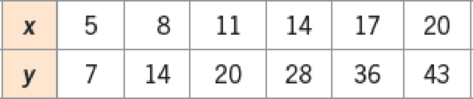
13. Create a linear model for the data in the table.
Expert Solution & Answer
Want to see the full answer?
Check out a sample textbook solution
Students have asked these similar questions
Consider the following data:
x
f
3
8
3.3
7.4
3.6
6.8
3.9
6.2
A. Test the data to see whether they are linear.
B. Make a linear model for the data.
The table below shows the high temperatures for each month of 2021 in Atlanta where month 1 is January. Write a trig model that represents the data.
Month
Temperature
1
53
2
57
3
65
4
73
5
80
6
86
7
88
8
87
9
82
10
72
11
63
12
55
Explain the steps you took to arrive at your solution.
Consider the following data.
x
2
2.2
2.4
2.6
f
9.0
8.4
7.8
7.2
(a) Test the data to see whether they are linear.
linear or not linear
(b) Make a linear model for the data.f(x) =
Chapter 2 Solutions
18 WEEK MY MATHLAB
Ch. 2.1 - In Exercises 112, solve the equations. 1. 5x 14 =...Ch. 2.1 - In Exercises 112, solve the equations. 2. 3x 2 =...Ch. 2.1 - In Exercises 112, solve the equations. 3. 3(x 7)...Ch. 2.1 - In Exercises 112, solve the equations. 4. 5(y 6)...Ch. 2.1 - In Exercises 112, solve the equations. 5....Ch. 2.1 - In Exercises 112, solve the equations. 6....Ch. 2.1 - In Exercises 112, solve the equations. 7....Ch. 2.1 - In Exercises 112, solve the equations. 8....Ch. 2.1 - In Exercises 112, solve the equations. 9. 5.92t =...Ch. 2.1 - In Exercises 112, solve the equations. 10. 0.023x...
Ch. 2.1 - In Exercises 112, solve the equations. 11....Ch. 2.1 - In Exercises 112, solve the equations. 12....Ch. 2.1 - 3(x 1) + 5 = 4(x 3) 2(2x 3)Ch. 2.1 - 5x (x 2) + 7 = (2x 9) 8(3x + 6)Ch. 2.1 - Prob. 15ECh. 2.1 - Prob. 16ECh. 2.1 - Prob. 17ECh. 2.1 - Prob. 18ECh. 2.1 - Prob. 19ECh. 2.1 - Prob. 20ECh. 2.1 - Prob. 21ECh. 2.1 - Prob. 22ECh. 2.1 - Prob. 23ECh. 2.1 - Prob. 24ECh. 2.1 - Prob. 25ECh. 2.1 - Prob. 26ECh. 2.1 - Prob. 27ECh. 2.1 - Prob. 28ECh. 2.1 - Prob. 29ECh. 2.1 - Prob. 30ECh. 2.1 - Prob. 31ECh. 2.1 - Prob. 32ECh. 2.1 - Prob. 33ECh. 2.1 - Prob. 34ECh. 2.1 - Prob. 35ECh. 2.1 - In Exercises 3340, solve the equations using...Ch. 2.1 - Prob. 37ECh. 2.1 - Prob. 38ECh. 2.1 - Prob. 39ECh. 2.1 - Prob. 40ECh. 2.1 - Prob. 41ECh. 2.1 - Solve V=13r2h for h.Ch. 2.1 - Prob. 43ECh. 2.1 - Prob. 44ECh. 2.1 - Prob. 45ECh. 2.1 - Prob. 46ECh. 2.1 - Prob. 47ECh. 2.1 - Prob. 48ECh. 2.1 - Prob. 49ECh. 2.1 - Prob. 50ECh. 2.1 - Prob. 51ECh. 2.1 - Temperature Conversion The equation 5F 9C = 160...Ch. 2.1 - Prob. 53ECh. 2.1 - Prob. 54ECh. 2.1 - Prob. 55ECh. 2.1 - Prob. 56ECh. 2.1 - Prob. 57ECh. 2.1 - Reading Score The average reading score on the...Ch. 2.1 - Prob. 59ECh. 2.1 - Prob. 60ECh. 2.1 - Prob. 61ECh. 2.1 - Prob. 62ECh. 2.1 - Prob. 63ECh. 2.1 - Prob. 64ECh. 2.1 - Prob. 65ECh. 2.1 - Population of Females Under 18 Using projected...Ch. 2.1 - Prob. 67ECh. 2.1 - Prob. 68ECh. 2.1 - Prob. 69ECh. 2.1 - Prob. 70ECh. 2.1 - Prob. 71ECh. 2.1 - Prob. 72ECh. 2.1 - Prob. 73ECh. 2.1 - Prob. 74ECh. 2.1 - Prob. 75ECh. 2.1 - Salaries A man earning 100,000 per year has his...Ch. 2.1 - Prob. 77ECh. 2.1 - Prob. 78ECh. 2.1 - Prob. 79ECh. 2.1 - Prob. 80ECh. 2.1 - Prob. 81ECh. 2.1 - Investment If an investment at 7% simple interest...Ch. 2.1 - Prob. 83ECh. 2.1 - Prob. 84ECh. 2.1 - Prob. 85ECh. 2.1 - Prob. 86ECh. 2.1 - Prob. 87ECh. 2.1 - Land Cost The cost of land in Savannah is directly...Ch. 2.2 - Report models to three decimal places unless...Ch. 2.2 - Report models to three decimal places unless...Ch. 2.2 - Discuss whether the data shown in the scatter...Ch. 2.2 - Prob. 4ECh. 2.2 - Create a scatter plot for each of the sets of data...Ch. 2.2 - Create a scatter plot for each of the sets of data...Ch. 2.2 - Can the scatter plot in Exercise 5 be fit exactly...Ch. 2.2 - Can the scatter plot in Exercise 6 be fit exactly...Ch. 2.2 - Find the linear function that is the best fit for...Ch. 2.2 - Find the linear function that is the best fit for...Ch. 2.2 - Use the data in the following table for Exercises...Ch. 2.2 - Use the data in the following table for Exercises...Ch. 2.2 - Use the data in the following table for Exercises...Ch. 2.2 - Use the data in the following table for Exercises...Ch. 2.2 - Use the data in the table for Exercises 1518. 15....Ch. 2.2 - Use the data in the table for Exercises 1518. 16....Ch. 2.2 - Use the data in the table for Exercises 1518. 17....Ch. 2.2 - Prob. 18ECh. 2.2 - Prob. 19ECh. 2.2 - Prob. 20ECh. 2.2 - Prob. 21ECh. 2.2 - Prob. 22ECh. 2.2 - Prob. 23ECh. 2.2 - Prob. 24ECh. 2.2 - Social Security Benefits The figure shows how...Ch. 2.2 - Future Value of an Investment If 1000 is invested...Ch. 2.2 - Drug Doses The table below shows the usual dosage...Ch. 2.2 - Cardiac Health A Paramount elliptical machine...Ch. 2.2 - Disposable Income Disposable income is the amount...Ch. 2.2 - Oil Imports Crude oil and petroleum products are...Ch. 2.2 - Annual Wage The table gives the average annual...Ch. 2.2 - Consumer Price Index The table on the next page...Ch. 2.2 - Diabetes As the following table shows, projections...Ch. 2.2 - Carbon Dioxide Emissions The table gives the...Ch. 2.2 - U.S. Population Over Age 16 The table gives the...Ch. 2.2 - U.S. Population The following table gives...Ch. 2.2 - Prob. 37ECh. 2.2 - Non-White Population The graph gives the number of...Ch. 2.2 - Prob. 39ECh. 2.2 - Civilian Labor Force The table gives the size of...Ch. 2.2 - Obesity People who are severely obese (BMI 40)...Ch. 2.2 - Male Civilian Labor Force The table gives the male...Ch. 2.2 - Population of the World The table on the following...Ch. 2.2 - Prob. 44ECh. 2.2 - Prob. 45ECh. 2.3 - Determine if each ordered pair is a solution of...Ch. 2.3 - Determine if each ordered pair is a solution of...Ch. 2.3 - What are the coordinates of the point of...Ch. 2.3 - Give the coordinates of the point of intersection...Ch. 2.3 - In Exercises 58, solve the systems of equations...Ch. 2.3 - In Exercises 58, solve the systems of equations...Ch. 2.3 - Prob. 7ECh. 2.3 - Prob. 8ECh. 2.3 - Prob. 9ECh. 2.3 - Prob. 10ECh. 2.3 - In Exercises 1114, solve the systems of equations...Ch. 2.3 - In Exercises 1114, solve the systems of equations...Ch. 2.3 - In Exercises 1114, solve the systems of equations...Ch. 2.3 - Prob. 14ECh. 2.3 - In Exercises 1524, solve the systems of equations...Ch. 2.3 - Prob. 16ECh. 2.3 - In Exercises 1524, solve the systems of equations...Ch. 2.3 - Prob. 18ECh. 2.3 - In Exercises 1524, solve the systems of equations...Ch. 2.3 - Prob. 20ECh. 2.3 - In Exercises 1524. solve the systems of equations...Ch. 2.3 - Prob. 22ECh. 2.3 - In Exercises 1524, solve the systems of equations...Ch. 2.3 - Prob. 24ECh. 2.3 - In Exercises 2534, solve the systems of equations...Ch. 2.3 - Prob. 26ECh. 2.3 - Prob. 27ECh. 2.3 - Prob. 28ECh. 2.3 - Prob. 29ECh. 2.3 - Prob. 30ECh. 2.3 - Prob. 31ECh. 2.3 - Prob. 32ECh. 2.3 - Prob. 33ECh. 2.3 - Prob. 34ECh. 2.3 - Prob. 35ECh. 2.3 - Prob. 36ECh. 2.3 - Prob. 37ECh. 2.3 - Break-Even A manufacturer of automobile air...Ch. 2.3 - Prob. 39ECh. 2.3 - Prob. 40ECh. 2.3 - Concerta and Ritalin Concerta and Ritalin are two...Ch. 2.3 - Prob. 42ECh. 2.3 - Prob. 43ECh. 2.3 - Prob. 44ECh. 2.3 - Prob. 45ECh. 2.3 - Age at First Marriage and First Birth The graph...Ch. 2.3 - Prob. 47ECh. 2.3 - Prob. 48ECh. 2.3 - Prob. 49ECh. 2.3 - Prob. 50ECh. 2.3 - Investment One safe investment pays 8% per year,...Ch. 2.3 - Investment A woman invests 52,000 in two different...Ch. 2.3 - Prob. 53ECh. 2.3 - Prob. 54ECh. 2.3 - Prob. 55ECh. 2.3 - Prob. 56ECh. 2.3 - Prob. 57ECh. 2.3 - Prob. 58ECh. 2.3 - Prob. 59ECh. 2.3 - Prob. 60ECh. 2.3 - Prob. 61ECh. 2.3 - Prob. 62ECh. 2.3 - Prob. 63ECh. 2.3 - Prob. 64ECh. 2.3 - Prob. 65ECh. 2.3 - Prob. 66ECh. 2.3 - Market Equilibrium A retail chain will buy 900...Ch. 2.4 - In Exercises 112, solve the inequalities both...Ch. 2.4 - In Exercises 112, solve the inequalities both...Ch. 2.4 - In Exercises 112, solve the inequalities both...Ch. 2.4 - In Exercises 112, solve the inequalities both...Ch. 2.4 - Prob. 5ECh. 2.4 - Prob. 6ECh. 2.4 - Prob. 7ECh. 2.4 - In Exercises 112, solve the inequalities both...Ch. 2.4 - Prob. 9ECh. 2.4 - Prob. 10ECh. 2.4 - Prob. 11ECh. 2.4 - Prob. 12ECh. 2.4 - In Exercises 13 and 14, solve graphically by the...Ch. 2.4 - In Exercises 13 and 14, solve graphically by the...Ch. 2.4 - In Exercises 15 and 16, solve graphically by the...Ch. 2.4 - In Exercises 15 and 16, solve graphically by the...Ch. 2.4 - The graphs of two linear functions f and g are...Ch. 2.4 - The graphs of three linear functions f, g, and h...Ch. 2.4 - In Exercises 1928, solve the double inequalities....Ch. 2.4 - In Exercises 1928, solve the double inequalities....Ch. 2.4 - Prob. 21ECh. 2.4 - Prob. 22ECh. 2.4 - Prob. 23ECh. 2.4 - Prob. 24ECh. 2.4 - Prob. 25ECh. 2.4 - Prob. 26ECh. 2.4 - Prob. 27ECh. 2.4 - In Exercises 1928, solve the double inequalities....Ch. 2.4 - Depreciation Suppose a business purchases...Ch. 2.4 - Blood Alcohol Percent The blood alcohol percent p...Ch. 2.4 - Freezing The equation F=92C+32 gives the...Ch. 2.4 - Prob. 32ECh. 2.4 - Job Selection Deb Cook is given the choice of two...Ch. 2.4 - Stock Market Susan Mason purchased 1000 shares of...Ch. 2.4 - Grades If Stan Cook has a course average score...Ch. 2.4 - Grades If John Deal has a course average score...Ch. 2.4 - Cigarette Use The percent of 12th graders who have...Ch. 2.4 - Prob. 38ECh. 2.4 - Social Security A person scheduled to receive a...Ch. 2.4 - Prob. 40ECh. 2.4 - Prob. 41ECh. 2.4 - Prison Sentences The mean time y spent in prison...Ch. 2.4 - Prob. 43ECh. 2.4 - Prob. 44ECh. 2.4 - Home Appraisal A home purchased in 1996 for...Ch. 2.4 - Prob. 46ECh. 2.4 - Prob. 47ECh. 2.4 - Prob. 48ECh. 2.4 - Break-Even A large hardware stores monthly profit...Ch. 2.4 - Prob. 50ECh. 2.4 - Break-Even A company produces a logic board for...Ch. 2.4 - Prob. 52ECh. 2.4 - Prob. 53ECh. 2.4 - Prob. 54ECh. 2.4 - Prob. 55ECh. 2.4 - Prob. 56ECh. 2 - In Exercises 18, state the property (or...Ch. 2 - Prob. 2TECh. 2 - Prob. 3TECh. 2 - Prob. 4TECh. 2 - Prob. 5TECh. 2 - Prob. 6TECh. 2 - In Exercises 18, state the property (or...Ch. 2 - In Exercises 18, state the property (or...Ch. 2 - Prob. 9TECh. 2 - Prob. 10TECh. 2 - Prob. 11TECh. 2 - Prob. 12TECh. 2 - Prob. 13TECh. 2 - Prob. 14TECh. 2 - Prob. 15TECh. 2 - Prob. 16TECh. 2 - Prob. 17TECh. 2 - In Exercises 1720, use the Substitution Property...Ch. 2 - Prob. 19TECh. 2 - Prob. 20TECh. 2 - Prob. 21TECh. 2 - Prob. 22TECh. 2 - Prob. 23TECh. 2 - Prob. 24TECh. 2 - Prob. 25TECh. 2 - Prob. 26TECh. 2 - Prob. 27TECh. 2 - Prob. 28TECh. 2 - Prob. 29TECh. 2 - Prob. 30TECh. 2 - Prob. 31TECh. 2 - Prob. 32TECh. 2 - Prob. 33TECh. 2 - Prob. 34TECh. 2 - Prob. 35TECh. 2 - Prob. 36TECh. 2 - Prob. 37TECh. 2 - Prob. 38TECh. 2 - Prob. 39TECh. 2 - Prob. 1RECh. 2 - Prob. 2RECh. 2 - Prob. 3RECh. 2 - Prob. 4RECh. 2 - Prob. 5RECh. 2 - Prob. 6RECh. 2 - Prob. 7RECh. 2 - Prob. 8RECh. 2 - Prob. 9RECh. 2 - Prob. 10RECh. 2 - Prob. 11RECh. 2 - Prob. 12RECh. 2 - Prob. 13RECh. 2 - Prob. 14RECh. 2 - Prob. 15RECh. 2 - Prob. 16RECh. 2 - Prob. 17RECh. 2 - Prob. 18RECh. 2 - Prob. 19RECh. 2 - Prob. 20RECh. 2 - Prob. 21RECh. 2 - Prob. 22RECh. 2 - Prob. 23RECh. 2 - Prob. 24RECh. 2 - Prob. 25RECh. 2 - Prob. 26RECh. 2 - Prob. 27RECh. 2 - Prob. 28RECh. 2 - Prob. 29RECh. 2 - Prob. 30RECh. 2 - Prob. 31RECh. 2 - Prob. 32RECh. 2 - Prob. 33RECh. 2 - Prob. 34RECh. 2 - Prob. 35RECh. 2 - Prob. 36RECh. 2 - Prob. 37RECh. 2 - Prob. 38RECh. 2 - Prob. 39RECh. 2 - Prob. 40RECh. 2 - Prob. 41RECh. 2 - Heart Rate The table gives the desired heart rate...Ch. 2 - Prob. 43RECh. 2 - Prob. 44RECh. 2 - Prob. 45RECh. 2 - Prob. 46RECh. 2 - Prob. 47RECh. 2 - Prob. 48RECh. 2 - Prob. 49RECh. 2 - Prob. 50RE
Knowledge Booster


Learn more about
Need a deep-dive on the concept behind this application? Look no further. Learn more about this topic, subject and related others by exploring similar questions and additional content below.Similar questions
- Build linear models from verbal descriptionsarrow_forward) Make a linear model for the following data. (Enter your answer in terms of x.) x 1 5 9 13 y 13 20 27 34arrow_forwardThe data in the following table show the amount of water in milliliters a professional tennis player loses for various times, in minutes, of play during a tennis match. Time of Workout(in minutes), x 10 20 30 40 50 60 Water Lost(in milliliters), y 600 900 1,200 1,500 2,000 2,200 (a)Use the points (10, 600) and (60, 2,200) to find a linear model that will predict the water lost y (in mL) by a player who has been playing for x minutes. (b) Use your linear model to estimate the amount of water lost (in mL) by a player who has been playing for 15 minutes.arrow_forward
- e below shows the number, in millions, graduating from high school in the United States in the given year.† Year Number 1975 3.13 1980 3.04 1985 2.68 1990 2.57 1994 2.46 1999 2.76 2004 3.05 2009 3.32 (a) Make a plot of the data. (Let N be the number, in millions, graduating from high school and let t be the number of years since 1975.) Explain why a linear model is not appropriate. The graph does not lie close to ---Select--- a single line multiple lines , so a linear model is not appropriate. (b) Use regression to find a linear model for the years 1975 through 1990. (Round regression line parameters to three decimal places.) N(t) = (c) Use regression to find a linear model for the years 1994 through 2009. (Round regression line parameters to three decimal places.) N(t) = (d) Write a formula for a model of the number, in millions, graduating as a piecewise-defined function using the linear models from part (b) and part (c).…arrow_forwardDo you observe a linear relationship between the two variables; consider R2?arrow_forwardThe data in the following table show the amount of water in milliliters a professional tennis player loses for various times, in minutes, of play during a tennis match. Time of Workout(in minutes), x 10 20 30 40 50 60 Water Lost(in milliliters), y 500 900 1,200 1,500 2,000 2,200 (a) Use the points (10, 500) and (60, 2,200) to find a linear model that will predict the water lost y (in mL) by a player who has been playing for x minutes. y = (b) Use your linear model to estimate the amount of water lost (in mL) by a player who has been playing for 15 minutes. mLarrow_forward
- The data in the following table show five students' reading test scores and final exam grades in a history class. Reading Test Score, x 8.5 9.4 10.0 11.4 12.0 History Final Exam Grade, y 62 68 74 87 92 (a) Use the points (8.5, 62) and (10.0, 74) to find a linear model that will predict a student's final exam grade, y, given his or her reading test score, x. y = (b) Use your linear model to estimate a student's final exam grade in the history class given that the student's reading test score was 9.5.arrow_forwardThe earnings per share for a social media company were $5.19 in 2017 and $7.53 in 2018. Use the midpoint formula to estimate the earnings (in dollars) per share in 2019. Assume that the earnings per share followed a linear pattern. $_______ per sharwarrow_forwardWhat is extrapolation when using a linear model?arrow_forward
- What is interpolation when using a linear model?arrow_forwardThe per capita consumption of breakfast cereal in the US has the following model that appears below...arrow_forwardThe data in the table below are not linear, but if we omit the first point, the remaining data are linear. Make a linear model for these last three points. (Enter your answer in terms of x.) x -1 1 3 5 y 3 8 14 20arrow_forward
arrow_back_ios
SEE MORE QUESTIONS
arrow_forward_ios
Recommended textbooks for you

 Big Ideas Math A Bridge To Success Algebra 1: Stu...AlgebraISBN:9781680331141Author:HOUGHTON MIFFLIN HARCOURTPublisher:Houghton Mifflin Harcourt
 Algebra & Trigonometry with Analytic GeometryAlgebraISBN:9781133382119Author:SwokowskiPublisher:Cengage
Big Ideas Math A Bridge To Success Algebra 1: Stu...
Algebra
ISBN:9781680331141
Author:HOUGHTON MIFFLIN HARCOURT
Publisher:Houghton Mifflin Harcourt
Algebra & Trigonometry with Analytic Geometry
Algebra
ISBN:9781133382119
Author:Swokowski
Publisher:Cengage
Correlation Vs Regression: Difference Between them with definition & Comparison Chart; Author: Key Differences;https://www.youtube.com/watch?v=Ou2QGSJVd0U;License: Standard YouTube License, CC-BY
Correlation and Regression: Concepts with Illustrative examples; Author: LEARN & APPLY : Lean and Six Sigma;https://www.youtube.com/watch?v=xTpHD5WLuoA;License: Standard YouTube License, CC-BY