Concept explainers
Videos
A Problems 9–16 refer to the following graph of y = f(x).
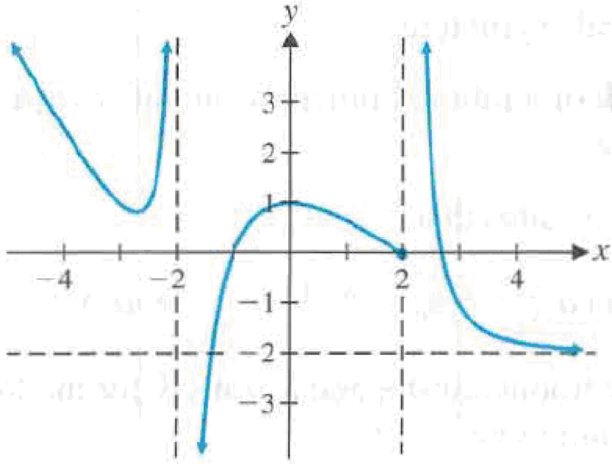
Figure for 9–10
15.

Trending nowThis is a popular solution!

Chapter 2 Solutions
Calculus for Business Economics Life Sciences and Social Sciences Plus NEW
Additional Math Textbook Solutions
Differential Equations: An Introduction to Modern Methods and Applications
Probability and Statistics for Engineers and Scientists
Mathematics with Applications In the Management, Natural, and Social Sciences (12th Edition)
A Survey of Mathematics with Applications (10th Edition) - Standalone book
Mathematics for Elementary Teachers with Activities (5th Edition)
Finite Mathematics for Business, Economics, Life Sciences and Social Sciences


- In Problems 13–24, use the graph of the function f given.arrow_forward7. Plot the graph of the following functions. a) y = b) y = x-3 x+2 5x-15 (x+2)(10x-30)arrow_forwardIn Problems 13–24, determine whether the graph is that of a function by using the vertical-line test. If it is, use the graph to find:(a) The domain and range (b) The intercepts, if any (c) Any symmetry with respect to the x-axis, the y-axis, or the originarrow_forward
- 2. Sketch the graph of following functions -1 x(x - 5) a) y = b) y -3 (x+3)²arrow_forwardIn Problems 19–26, sketch the graph of each function. Be sure to label three points on the grapharrow_forward5) Graph the following functions. a) P(x) = x 4x 1 S c) P(x) = - b) P(x) = x² + 2x + 7 - 2(x + 2)² + 4 d) P(x) = (x − 1)² - 2arrow_forward
- 3. Briefly describe the characteristics of the graph of y = f(x) that can be deduced from each of the following statements.arrow_forwardC. 600th D. 800th 28. Based on employment data from 1970 to 2006, the percent of total US workers who are female 78.7t + 1580 can be modeled by the function p(t) = where t is the number of years since %3D 1.63t + 48.8 1970. We find that lim p(t) = 48.25. What does this mean? %3D 28) A. The number of females in the workforce is increasing by 48.25% per year. B. The number of females in the workforce is decreasing by 48.25% per year. C. There currently are 48.25 women working. D. If current trends continue, the percentage of total US workers will level off at 48.25%.arrow_forward3D. Choose 5 convenient points on the given graph of the parent function, and transform the points appropriately to graph b(x) =(1/3x) square on the same coordinate system. Use the provided table to guide your workarrow_forward
- 12. Which of the following is true about the graph of the function, y= (x-2)³(x-1)*(x+4)? A. The graph falls to the left and rises to the right. B. The graph is tangent to x-axis at x=4. C. The graph is tangent to x-axis at x=1 D. The graph crosses the x-axis at x=1.arrow_forwardSuppose the graph of f(x) = x2is shifted up 2 unitsand to the right 5 units. What is the equation of thenew graph? Verify the result graphically.arrow_forwardDescribe how to transform the graph of the cubing function (y = x3) in order to get the graph of each of the following: y = x3 + 7 y = 4x3 y = (x – 4)3 – 2arrow_forward
 Calculus: Early TranscendentalsCalculusISBN:9781285741550Author:James StewartPublisher:Cengage Learning
 Thomas' Calculus (14th Edition)CalculusISBN:9780134438986Author:Joel R. Hass, Christopher E. Heil, Maurice D. WeirPublisher:PEARSON
 Calculus: Early Transcendentals (3rd Edition)CalculusISBN:9780134763644Author:William L. Briggs, Lyle Cochran, Bernard Gillett, Eric SchulzPublisher:PEARSON
 Calculus: Early TranscendentalsCalculusISBN:9781319050740Author:Jon Rogawski, Colin Adams, Robert FranzosaPublisher:W. H. Freeman
 Calculus: Early Transcendental FunctionsCalculusISBN:9781337552516Author:Ron Larson, Bruce H. EdwardsPublisher:Cengage Learning