
Statistics: The Art and Science of Learning from Data (4th Edition)
4th Edition
ISBN: 9780321997838
Author: Alan Agresti, Christine A. Franklin, Bernhard Klingenberg
Publisher: PEARSON
expand_more
expand_more
format_list_bulleted
Concept explainers
Videos
Textbook Question
Chapter 2.2, Problem 20PB
Histogram for sugar For the breakfast cereal data, the figure below shows a histogram for the sugar values in grams.
- a. Identify the intervals of sugar values used for the plot.
- b. Describe the shape of the distribution. What do you think might account for this unusual shape? (Hint: How else are the cereals classified in Table 2.3?)
- c. What information can you get from the dot plot or stem-and-leaf plot of these data shown in Exercises 2.15 and 2.19 that you cannot get from this plot?
- d. This histogram shows frequencies. If you were to construct a histogram by using the percentages for each interval, how (if at all) would the shape of this histogram change?
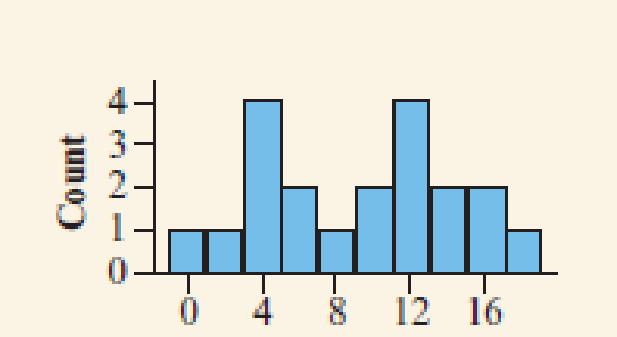
Sugar (g)
Sugar dot plot For the breakfast cereal data given in Table 2.3, a dot plot for the sugar values (in grams) is shown:
- a. Identify the minimum and maximum sugar values.
- b. Which sugar outcomes occur most frequently? What are these values called?
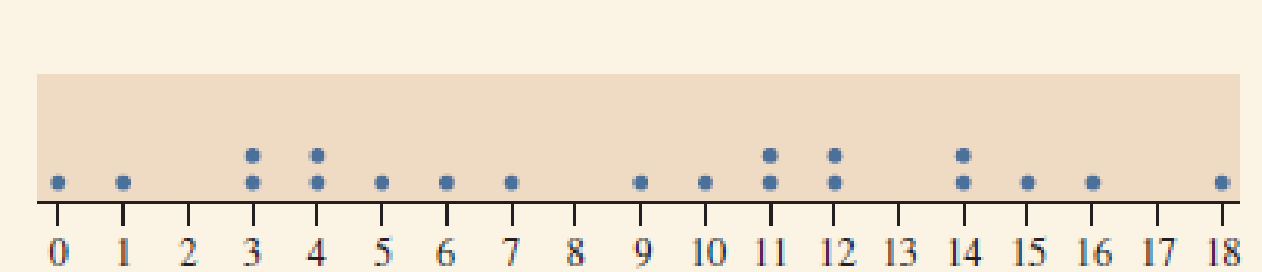
Sugar (g)
2.19 Split Stems The figure below shows the stem-and-leaf plot for the cereal sugar values from Example 5, using split stems.
Stem and Leaf Plot for Cereal Sugar Values with Leaf Unit = 1000
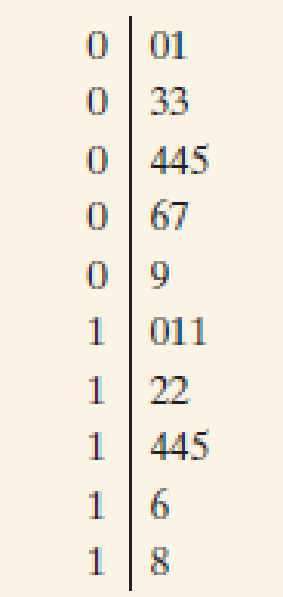
- a. What was the smallest and largest amount of sugar found in the 20 cereals?
- b. What sugar values are represented on the 6th line of the plot?
- c. How many cereals have a sugar content less than 5 g?
Expert Solution & Answer
Want to see the full answer?
Check out a sample textbook solution
Chapter 2 Solutions
Statistics: The Art and Science of Learning from Data (4th Edition)
Ch. 2.1 - Categorical/quantitative difference a. Explain the...Ch. 2.1 - U.S. married-couple households According to a...Ch. 2.1 - Identify the variable type Identify each of the...Ch. 2.1 - Categorical or quantitative? Identify each of the...Ch. 2.1 - Discrete/continuous a. Explain the difference...Ch. 2.1 - Discrete or continuous? Identify each of the...Ch. 2.1 - Discrete or continuous 2 Repeat the previous...Ch. 2.1 - Prob. 8PBCh. 2.1 - Fatal Shark Attacks Few of the shark attacks...Ch. 2.2 - Generating Electricity In 2012 in the United...
Ch. 2.2 - What do alligators eat? The bar chart is from a...Ch. 2.2 - Prob. 12PBCh. 2.2 - Prob. 13PBCh. 2.2 - Prob. 14PBCh. 2.2 - Sugar dot plot For the breakfast cereal data given...Ch. 2.2 - Prob. 16PBCh. 2.2 - Graphing exam scores A teacher shows her class the...Ch. 2.2 - Fertility rates The fertility rate for a nation is...Ch. 2.2 - Split Stems The figure below shows the...Ch. 2.2 - Histogram for sugar For the breakfast cereal data,...Ch. 2.2 - Prob. 21PBCh. 2.2 - Prob. 22PBCh. 2.2 - Prob. 23PBCh. 2.2 - Prob. 24PBCh. 2.2 - Prob. 25PBCh. 2.2 - Prob. 26PBCh. 2.2 - Prob. 27PBCh. 2.2 - Warming in Newnan, Georgia? Access the Newnan, GA...Ch. 2.3 - Median versus mean For each of the following...Ch. 2.3 - Prob. 30PBCh. 2.3 - Prob. 31PBCh. 2.3 - Resistance to an outlier Consider the following...Ch. 2.3 - Income and health insurance According to the U.S....Ch. 2.3 - Prob. 34PBCh. 2.3 - Prob. 35PBCh. 2.3 - Prob. 36PBCh. 2.3 - Public transportationcenter The owner of a company...Ch. 2.3 - Prob. 38PBCh. 2.3 - Prob. 39PBCh. 2.3 - European fertility The European fertility rates...Ch. 2.3 - Sex partners A recent General Social Survey asked...Ch. 2.3 - Prob. 43PBCh. 2.3 - Prob. 44PBCh. 2.3 - Prob. 45PBCh. 2.4 - Sick leave A company decides to investigate the...Ch. 2.4 - Prob. 47PBCh. 2.4 - Prob. 48PBCh. 2.4 - Prob. 49PBCh. 2.4 - Exam standard deviation For an exam given to a...Ch. 2.4 - Heights For the sample heights of Georgia college...Ch. 2.4 - Histograms and standard deviation The figure shows...Ch. 2.4 - Female strength The High School Female Athletes...Ch. 2.4 - Female body weight The College Athletes data file...Ch. 2.4 - Shape of cigarette taxes A recent summary for the...Ch. 2.4 - Empirical rule and skewed, highly discrete...Ch. 2.4 - How much TV? The 2012 General Social Survey asked,...Ch. 2.4 - How many friends? A recent General Social Survey...Ch. 2.4 - Judging skew using x and s If the largest...Ch. 2.4 - Youth unemployment in the EU The Youth...Ch. 2.4 - Create data with a given standard deviation Use...Ch. 2.5 - Vacation days National Geographic Traveler...Ch. 2.5 - Youth unemployment In recent years, many European...Ch. 2.5 - Female strength The High School Female Athletes...Ch. 2.5 - Female body weight The College Athletes data file...Ch. 2.5 - Ways to measure variability The standard...Ch. 2.5 - Variability of cigarette taxes Heres the...Ch. 2.5 - Prob. 68PBCh. 2.5 - Infant mortality Africa The Human Development...Ch. 2.5 - Prob. 70PBCh. 2.5 - Computer use During a recent semester at the...Ch. 2.5 - Central Park temperature distribution revisited...Ch. 2.5 - Box plot for exam The scores on an exam have mean...Ch. 2.5 - Public transportation Exercise 2.37 described a...Ch. 2.5 - Prob. 75PBCh. 2.5 - Prob. 76PBCh. 2.5 - Prob. 77PBCh. 2.5 - Prob. 78PBCh. 2.5 - Prob. 79PBCh. 2.5 - Prob. 80PBCh. 2.5 - Prob. 81PBCh. 2.5 - Prob. 82PBCh. 2.6 - Great pay (on the average) The six full-time...Ch. 2.6 - Prob. 84PBCh. 2.6 - Prob. 85PBCh. 2.6 - Terrorism and war in Iraq In 2004, a college...Ch. 2.6 - Prob. 87PBCh. 2.6 - Prob. 88PBCh. 2 - Categorical or quantitative? Identify each of the...Ch. 2 - Continuous or discrete? Which of the following...Ch. 2 - Prob. 92CPCh. 2 - Cool in China A recent survey8 asked 1200...Ch. 2 - Prob. 94CPCh. 2 - Prob. 95CPCh. 2 - Prob. 96CPCh. 2 - Prob. 97CPCh. 2 - Prob. 98CPCh. 2 - Prob. 99CPCh. 2 - Prob. 100CPCh. 2 - Prob. 101CPCh. 2 - Prob. 103CPCh. 2 - Household net worth A study reported that in 2007...Ch. 2 - Prob. 105CPCh. 2 - Prob. 106CPCh. 2 - Prob. 107CPCh. 2 - Central Park monthly temperatures The MINITAB...Ch. 2 - Prob. 109CPCh. 2 - Female heights According to a recent report from...Ch. 2 - Energy and water consumption In parts a and b,...Ch. 2 - Prob. 112CPCh. 2 - More hurricane damage Refer to the previous...Ch. 2 - Prob. 114CPCh. 2 - Prob. 115CPCh. 2 - Prob. 116CPCh. 2 - Prob. 117CPCh. 2 - Temperatures in Central Park Access the Central...Ch. 2 - Teachers salaries According to Statistical...Ch. 2 - Prob. 120CPCh. 2 - What box plot do you expect? For each of the...Ch. 2 - Prob. 122CPCh. 2 - Prob. 123CPCh. 2 - Prob. 124CPCh. 2 - Prob. 125CPCh. 2 - Who was Roger Maris? Roger Maris, who spent most...Ch. 2 - Baseballs great home run hitters The Baseballs HR...Ch. 2 - Prob. 128CPCh. 2 - Controlling asthma A study of 13 children...Ch. 2 - Prob. 130CPCh. 2 - Youth unemployment by gender The side-by-side box...Ch. 2 - You give examples Give an example of a variable...Ch. 2 - Political conservatism and liberalism Where do...Ch. 2 - Mode but not median and mean The previous exercise...Ch. 2 - Multiple choice: GRE scores In a study of graduate...Ch. 2 - Multiple choice: Fact about s Which statement...Ch. 2 - Prob. 137CPCh. 2 - True or false: a. The mean, median, and mode can...Ch. 2 - Bad statistic A teacher summarizes grades on an...Ch. 2 - True or false: Soccer According to a story in the...Ch. 2 - Mean for grouped data Refer to the calculation of...Ch. 2 - Prob. 142CPCh. 2 - Range and standard deviation approximation Use the...Ch. 2 - Range the least resistant Weve seen that measures...Ch. 2 - Using MAD to measure variability The standard...Ch. 2 - Prob. 146CPCh. 2 - Create own data For the Mean Versus Median web...
Knowledge Booster


Learn more about
Need a deep-dive on the concept behind this application? Look no further. Learn more about this topic, statistics and related others by exploring similar questions and additional content below.Recommended textbooks for you
 Glencoe Algebra 1, Student Edition, 9780079039897...AlgebraISBN:9780079039897Author:CarterPublisher:McGraw Hill
 Big Ideas Math A Bridge To Success Algebra 1: Stu...AlgebraISBN:9781680331141Author:HOUGHTON MIFFLIN HARCOURTPublisher:Houghton Mifflin Harcourt
 Holt Mcdougal Larson Pre-algebra: Student Edition...AlgebraISBN:9780547587776Author:HOLT MCDOUGALPublisher:HOLT MCDOUGAL
Glencoe Algebra 1, Student Edition, 9780079039897...
Algebra
ISBN:9780079039897
Author:Carter
Publisher:McGraw Hill
Big Ideas Math A Bridge To Success Algebra 1: Stu...
Algebra
ISBN:9781680331141
Author:HOUGHTON MIFFLIN HARCOURT
Publisher:Houghton Mifflin Harcourt
Holt Mcdougal Larson Pre-algebra: Student Edition...
Algebra
ISBN:9780547587776
Author:HOLT MCDOUGAL
Publisher:HOLT MCDOUGAL
Continuous Probability Distributions - Basic Introduction; Author: The Organic Chemistry Tutor;https://www.youtube.com/watch?v=QxqxdQ_g2uw;License: Standard YouTube License, CC-BY
Probability Density Function (p.d.f.) Finding k (Part 1) | ExamSolutions; Author: ExamSolutions;https://www.youtube.com/watch?v=RsuS2ehsTDM;License: Standard YouTube License, CC-BY
Find the value of k so that the Function is a Probability Density Function; Author: The Math Sorcerer;https://www.youtube.com/watch?v=QqoCZWrVnbA;License: Standard Youtube License