
Statistics: The Art and Science of Learning from Data (4th Edition)
4th Edition
ISBN: 9780321997838
Author: Alan Agresti, Christine A. Franklin, Bernhard Klingenberg
Publisher: PEARSON
expand_more
expand_more
format_list_bulleted
Videos
Textbook Question
Chapter 2, Problem 129CP
Controlling asthma A study of 13 children suffering from asthma (Clinical and Experimental Allergy, vol. 20, pp. 429–432, 1990) compared single inhaled doses of formoterol (F) and salbutamol (S). Each child was evaluated using both medications. The outcome measured was the child’s peak expiratory flow (PEF) eight hours following treament. Is there a difference in the PEF level for the two medications? The data on PEF follow:
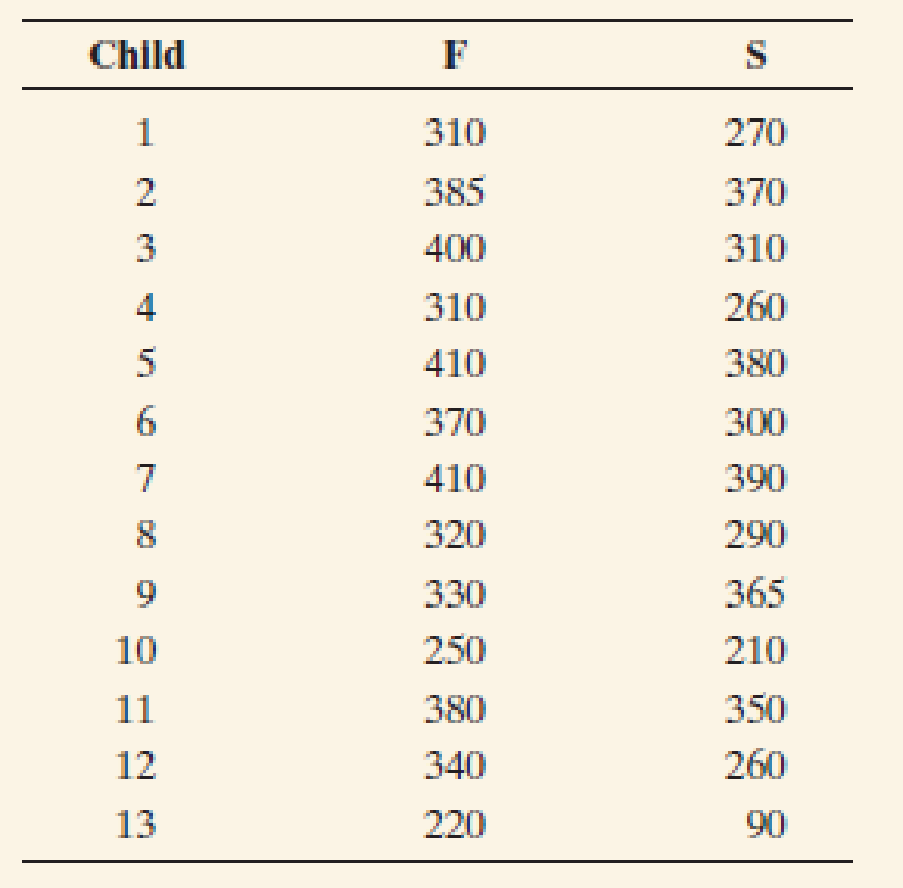
- a. Construct plots to compare formoterol and salbutamol. Write a short summary comparing the two distributions of the peak expiratory flow.
- b. Consider the distribution of differences between the PEF levels of the two medications. Find the 13 differences and construct and interpret a plot of the differences. If on the average there is no difference between the PEF level for the two brands, where would you expect the differences to be centered?
Expert Solution & Answer
Want to see the full answer?
Check out a sample textbook solution
Students have asked these similar questions
Body Fat. J. McWhorter et al. of the College of Health Sciences at the University of Nevada, Las Vegas, studied physical therapy students during their graduate-school years. The researchers were interested in the fact that, although graduate physical-therapy students are taught the principles of fitness, some have difficulty finding the time to implement those principles. In the study, published as “An Evaluation of Physical Fitness Parameters for Graduate Students” (Journal of American College Health, Vol. 51, No. 1, pp. 32–37), a sample of 27 female graduate physical-therapy students had a mean of 22.46 percent body fat.
a. Assuming that percent body fat of female graduate physicaltherapy students is normally distributed with standard deviation 4.10 percent body fat, determine a 95% confidence interval for the mean percent body fat of all female graduate physical-therapy students.
b. Obtain the margin of error, E, for the confidence interval you found in part (a).
c. Explain the…
Lobbying Congress. In the special report, “Bitter Pill: Why Medical Bills Are Killing Us” (TIME, Vol. 181, No. 8, 2013), S. Brill presented an in-depth investigation of hospital billing practices that reveals why U.S. health care spending is out of control. One of the many statistics provided in the report is that, during the period from 1998 through 2012, thepharmaceutical and health-care-products industries and organizations representing doctors, hospitals, nursing homes, health services, and HMOs spent $5.36 billion lobbying Congress.
a. Under what conditions would the $5.36 billion lobbyingexpenditure gure be a descriptive statistic? Explain your answer.b. Under what conditions would the $5.36 billion lobbyingexpenditure gure be an inferential statistic? Explain your answer.
Ethnicity and Movie Admissions Are movie admissions related to ethnicity? A 2007 study indicated the following numbers of admissions (in thousands) for two different years. At =α0.025level of significance, can it be concluded that the movie attendance by year was dependent on ethnicity?
Caucasian
Hispanic
African-American
Other
2006 - 935 250 215 107
2007- 910 287 130 144
Chapter 2 Solutions
Statistics: The Art and Science of Learning from Data (4th Edition)
Ch. 2.1 - Categorical/quantitative difference a. Explain the...Ch. 2.1 - U.S. married-couple households According to a...Ch. 2.1 - Identify the variable type Identify each of the...Ch. 2.1 - Categorical or quantitative? Identify each of the...Ch. 2.1 - Discrete/continuous a. Explain the difference...Ch. 2.1 - Discrete or continuous? Identify each of the...Ch. 2.1 - Discrete or continuous 2 Repeat the previous...Ch. 2.1 - Prob. 8PBCh. 2.1 - Fatal Shark Attacks Few of the shark attacks...Ch. 2.2 - Generating Electricity In 2012 in the United...
Ch. 2.2 - What do alligators eat? The bar chart is from a...Ch. 2.2 - Prob. 12PBCh. 2.2 - Prob. 13PBCh. 2.2 - Prob. 14PBCh. 2.2 - Sugar dot plot For the breakfast cereal data given...Ch. 2.2 - Prob. 16PBCh. 2.2 - Graphing exam scores A teacher shows her class the...Ch. 2.2 - Fertility rates The fertility rate for a nation is...Ch. 2.2 - Split Stems The figure below shows the...Ch. 2.2 - Histogram for sugar For the breakfast cereal data,...Ch. 2.2 - Prob. 21PBCh. 2.2 - Prob. 22PBCh. 2.2 - Prob. 23PBCh. 2.2 - Prob. 24PBCh. 2.2 - Prob. 25PBCh. 2.2 - Prob. 26PBCh. 2.2 - Prob. 27PBCh. 2.2 - Warming in Newnan, Georgia? Access the Newnan, GA...Ch. 2.3 - Median versus mean For each of the following...Ch. 2.3 - Prob. 30PBCh. 2.3 - Prob. 31PBCh. 2.3 - Resistance to an outlier Consider the following...Ch. 2.3 - Income and health insurance According to the U.S....Ch. 2.3 - Prob. 34PBCh. 2.3 - Prob. 35PBCh. 2.3 - Prob. 36PBCh. 2.3 - Public transportationcenter The owner of a company...Ch. 2.3 - Prob. 38PBCh. 2.3 - Prob. 39PBCh. 2.3 - European fertility The European fertility rates...Ch. 2.3 - Sex partners A recent General Social Survey asked...Ch. 2.3 - Prob. 43PBCh. 2.3 - Prob. 44PBCh. 2.3 - Prob. 45PBCh. 2.4 - Sick leave A company decides to investigate the...Ch. 2.4 - Prob. 47PBCh. 2.4 - Prob. 48PBCh. 2.4 - Prob. 49PBCh. 2.4 - Exam standard deviation For an exam given to a...Ch. 2.4 - Heights For the sample heights of Georgia college...Ch. 2.4 - Histograms and standard deviation The figure shows...Ch. 2.4 - Female strength The High School Female Athletes...Ch. 2.4 - Female body weight The College Athletes data file...Ch. 2.4 - Shape of cigarette taxes A recent summary for the...Ch. 2.4 - Empirical rule and skewed, highly discrete...Ch. 2.4 - How much TV? The 2012 General Social Survey asked,...Ch. 2.4 - How many friends? A recent General Social Survey...Ch. 2.4 - Judging skew using x and s If the largest...Ch. 2.4 - Youth unemployment in the EU The Youth...Ch. 2.4 - Create data with a given standard deviation Use...Ch. 2.5 - Vacation days National Geographic Traveler...Ch. 2.5 - Youth unemployment In recent years, many European...Ch. 2.5 - Female strength The High School Female Athletes...Ch. 2.5 - Female body weight The College Athletes data file...Ch. 2.5 - Ways to measure variability The standard...Ch. 2.5 - Variability of cigarette taxes Heres the...Ch. 2.5 - Prob. 68PBCh. 2.5 - Infant mortality Africa The Human Development...Ch. 2.5 - Prob. 70PBCh. 2.5 - Computer use During a recent semester at the...Ch. 2.5 - Central Park temperature distribution revisited...Ch. 2.5 - Box plot for exam The scores on an exam have mean...Ch. 2.5 - Public transportation Exercise 2.37 described a...Ch. 2.5 - Prob. 75PBCh. 2.5 - Prob. 76PBCh. 2.5 - Prob. 77PBCh. 2.5 - Prob. 78PBCh. 2.5 - Prob. 79PBCh. 2.5 - Prob. 80PBCh. 2.5 - Prob. 81PBCh. 2.5 - Prob. 82PBCh. 2.6 - Great pay (on the average) The six full-time...Ch. 2.6 - Prob. 84PBCh. 2.6 - Prob. 85PBCh. 2.6 - Terrorism and war in Iraq In 2004, a college...Ch. 2.6 - Prob. 87PBCh. 2.6 - Prob. 88PBCh. 2 - Categorical or quantitative? Identify each of the...Ch. 2 - Continuous or discrete? Which of the following...Ch. 2 - Prob. 92CPCh. 2 - Cool in China A recent survey8 asked 1200...Ch. 2 - Prob. 94CPCh. 2 - Prob. 95CPCh. 2 - Prob. 96CPCh. 2 - Prob. 97CPCh. 2 - Prob. 98CPCh. 2 - Prob. 99CPCh. 2 - Prob. 100CPCh. 2 - Prob. 101CPCh. 2 - Prob. 103CPCh. 2 - Household net worth A study reported that in 2007...Ch. 2 - Prob. 105CPCh. 2 - Prob. 106CPCh. 2 - Prob. 107CPCh. 2 - Central Park monthly temperatures The MINITAB...Ch. 2 - Prob. 109CPCh. 2 - Female heights According to a recent report from...Ch. 2 - Energy and water consumption In parts a and b,...Ch. 2 - Prob. 112CPCh. 2 - More hurricane damage Refer to the previous...Ch. 2 - Prob. 114CPCh. 2 - Prob. 115CPCh. 2 - Prob. 116CPCh. 2 - Prob. 117CPCh. 2 - Temperatures in Central Park Access the Central...Ch. 2 - Teachers salaries According to Statistical...Ch. 2 - Prob. 120CPCh. 2 - What box plot do you expect? For each of the...Ch. 2 - Prob. 122CPCh. 2 - Prob. 123CPCh. 2 - Prob. 124CPCh. 2 - Prob. 125CPCh. 2 - Who was Roger Maris? Roger Maris, who spent most...Ch. 2 - Baseballs great home run hitters The Baseballs HR...Ch. 2 - Prob. 128CPCh. 2 - Controlling asthma A study of 13 children...Ch. 2 - Prob. 130CPCh. 2 - Youth unemployment by gender The side-by-side box...Ch. 2 - You give examples Give an example of a variable...Ch. 2 - Political conservatism and liberalism Where do...Ch. 2 - Mode but not median and mean The previous exercise...Ch. 2 - Multiple choice: GRE scores In a study of graduate...Ch. 2 - Multiple choice: Fact about s Which statement...Ch. 2 - Prob. 137CPCh. 2 - True or false: a. The mean, median, and mode can...Ch. 2 - Bad statistic A teacher summarizes grades on an...Ch. 2 - True or false: Soccer According to a story in the...Ch. 2 - Mean for grouped data Refer to the calculation of...Ch. 2 - Prob. 142CPCh. 2 - Range and standard deviation approximation Use the...Ch. 2 - Range the least resistant Weve seen that measures...Ch. 2 - Using MAD to measure variability The standard...Ch. 2 - Prob. 146CPCh. 2 - Create own data For the Mean Versus Median web...
Knowledge Booster


Learn more about
Need a deep-dive on the concept behind this application? Look no further. Learn more about this topic, statistics and related others by exploring similar questions and additional content below.Similar questions
- Neutropenia. Neutropenia is an abnormally low number of neutrophils (a type of white blood cell) in the blood. Chemotherapy often reduces the number of neutrophils to a level that makes patients susceptible to fever and infections. G. Bucaneve et al. published a study of such cancer patients in the paper “Levofloxacin to Prevent Bacterial Infection in Patients With Cancer and Neutropenia” (New England Journal of Medicine, Vol. 353, No. 10, pp. 977–987). For the study, 375 patients were randomly assigned to receive a daily dose of levofloxacin, and 363 were given placebo. In the group receiving levofloxacin, fever was present in 243 patients for the duration of neutropenia, whereas fever was experienced by 308 patients in the placebo group. a. At the 1% significance level, do the data provide sufficient evidence to conclude that levofloxacin is effective in reducing the occurrence of fever in such patients? b. Find a 98% confidence level for the difference in the proportions of such…arrow_forwardLobbying Congress. In the special report, “Bitter Pill: Why Medical Bills Are Killing Us” (TIME, Vol. 181, No. 8, 2013), S. Brill presented an in-depth investigation of hospital billing practices that reveals why U.S. health care spending is out of control. One of the many statistics provided in the report is that, during the period from 1998 through 2012, the pharmaceutical and health-care-products industries and organizations representing doctors, hospitals, nursing homes, health services, and HMOs spent $5.36 billion lobbying Congress. a. Under what conditions would the $5.36 billion lobbyingexpenditure figure be a descriptive statistic? Explain your answer. b. Under what conditions would the $5.36 billion lobbyingexpenditure figure be an inferential statistic? Explain your answer.arrow_forwardPrenatal care Results of a 1996 American MedicalAssociation report about the infant mortality rate fortwins carried for the full term of a normal pregnancy areshown on the next page, broken down by the level ofprenatal care the mother had received.a) Is the overall rate the average of the other three rates?Should it be? Explain.b) Do these results indicate that adequate prenatal careis important for pregnant women? Explain.c) Do these results suggest that a woman pregnant withtwins should be wary of seeking too much medicalcare? Explain.arrow_forward
- Empty Stomachs. In the publication “How Often Do Fishes ‘Run on Empty’?” (Ecology, Vol. 83, No 8, pp. 2145–2151), D. Arrington et al. examined almost 37,000 fish of 254 species from the waters of Africa, South and Central America, and North America to determine the percentage of fish with empty stomachs. The fish were classified as piscivores (fish-eating), invertivores (invertibrateeating), omnivores (anything-eating) and algivores/detritivores (eating algae and other organic matter). For those fish in African waters, the data on theWeissStats site give the proportions of each species of fish with empty stomachs. At the 1% significance level, do the data provide sufficient evidence to conclude that a difference exists in the mean percentages of fish with empty stomachs among the four different types of feeders? a. conduct a one-way ANOVA test on the data. b. interpret your results from part (a). c. decide whether presuming that the assumptions of normal populations and equal…arrow_forwardGrey-Seal Nursing. Grey seals are one of several types of earless seals. The length of time that a female grey seal nurses her pup is studied by S. Twiss et al. in the article “Variation in Female Grey Seal (Halichoerus grypus) Reproductive Performance Correlates to Proactive-Reactive Behavioural Types” (PLOS ONE 7(11): e49598. doi:10.1371/journal.pone.0049598). The average lactation (nursing) period of all earless seals is 23 days. A hypothesis test is to be performed to decide whether the mean lactation period of grey seals differs from 23 days. a. determine the null hypothesis. b. determine the alternative hypothesis. c. classify the hypothesis test as two tailed, left tailed, or right tailed.arrow_forward1 (part 2). Does When Food Is Eaten Affect Weight Gain?A study was introduced that examined the effect of light at night on weight gain in mice. In the full study of 27 mice over a four-week period, the mice who had a light on at night gained significantly more weight than the mice with darkness at night, despite eating the same number of calories and exercising the same amount. Researchers noticed that the mice with light at night ate a greater percentage of their calories during the day (when mice are supposed to be sleeping). The computer output shown below allows us to examine the relationship between percent of calories eaten during the day, DayPct, and body mass gain in grams, BMGain. A scatterplot with regression line is also shown below (attached image).Pearson correlation of BMGain and DayPct =0.740P-Value =0.000--------------------------------------------------------------The regression equation isBMGain=1.11+0.127DayPct Predictor Coef SE Coef T P Constant 1.113 1.382…arrow_forward
- Forecasting movie revenues with Twitter. A study presented at the 2010 IEEE International Conference Intelligence and Intelligent Agent Technology investigated whether the volume of chatter on Twitter.com could be used to forecast the box office revenues of movies. For each in a sample of 24 recent movies, opening weekend box office revenue (in millions of dollars) was measured as well as the movie’s tweet rate (the average number of tweets referring to the movie one week prior to the movie’s release).a. In this study, identify the dependent and independent variables.b. Write the equation of the straight-line.arrow_forwardThe study “Evaluation of Prescribed Burning in Relation to Available Deer Browse” was undertaken at the Virginia Polytechnic Institute and State University in 1964 to determine if fire can be used as a viable management tool to increase the amount of forage available to deer during the crucial months in late winter and spring. Calcium is a required element for plants and animals. The amount taken up and stored in the plant is closely correlated to the amount present in the soil. It was hypothesized that fire may change the calcium levels present in the soil and thus affect the amount available to the deer. A large tract of land in the Fishburn Forest was selected for a prescribed burn. Soil samples were taken from 12 plots of equal area just prior to the burn on May 20, 1964, and analyzed for calcium. On July 16, 1964, postburn calcium levels were analyzed from the same plots. These values, in kilograms per plot, are presented in the following table. Do these data support the…arrow_forward1 (part 1). Does When Food Is Eaten Affect Weight Gain?A study was introduced that examined the effect of light at night on weight gain in mice. In the full study of 27 mice over a four-week period, the mice who had a light on at night gained significantly more weight than the mice with darkness at night, despite eating the same number of calories and exercising the same amount. Researchers noticed that the mice with light at night ate a greater percentage of their calories during the day (when mice are supposed to be sleeping). The computer output shown below allows us to examine the relationship between percent of calories eaten during the day, DayPct, and body mass gain in grams, BMGain. A scatterplot with regression line is also shown below (attached image).Pearson correlation of BMGain and DayPct =0.740P-Value =0.000--------------------------------------------------------------The regression equation isBMGain=1.11+0.127DayPct Predictor Coef SE Coef T P Constant 1.113 1.382…arrow_forward
- 1.“Effects of Short-Term Supplementation with Selenised Yeast on Milk Production and Composition of Lactating Cows”(Australian Journal of Dairy Technology, [2004]: 199-203) supplied the following data on milk selenium concentration (mg/L) for a sample of cows given seleniumsupplement (the treatment group) and a sample of cows given no supplement (the control group). The measurements of selenium were taken initally and again after a 9-day period. The study was conducted becausea deficiency of the trace element selenium in the diet can negatively impact growth, immunity, muscle and neuromuscular function, and fertility. The production of selenium supplements to dairy cows is justified when pastures have low selenium levels. data is attached a.Use the given data for the treatment group to determine if there is sufficient evidenceto conclude that the mean selenium concentration is greater after 9 days of the selenium supplement. b.Are the data for the cows in…arrow_forwardLearning math Developers of a new math curriculumcalled “Accelerated Math” compared performances ofstudents taught by their system with control groups ofstudents in the same schools who were taught using traditional instructional methods and materials. Statis-tics about pretest and posttest scores are shown in the table. (J. Ysseldyke and S. Tardrew, Differentiating MathInstruction, Renaissance Learning, 2002)a) Did the groups differ in average math score at thestart of this study? b) Did the group taught using the Accelerated Math pro-gram show a significant improvement in test scores? c) Did the control group show a significant improve-ment in test scores? d) Were gains significantly higher for the AcceleratedMath group than for the control group? Instructional MethodAcc. math ControlNumber of students 231 245Pretest Mean 560.01 549.65St. Dev 84.29 74.68Post-test Mean 637.55 588.76St. Dev 82.9 83.24Individual gain Mean 77.53 39.11St. Dev. 78.01 66.25arrow_forwardHeight and Breast Cancer. In the article “Height and Weight at Various Ages and Risk of Breast Cancer” (Annals of Epidemiology, Vol. 2, pp. 597–609), L. Brinton and C. Swanson discussed the relationship between height and breast cancer. The study, sponsored by the National Cancer Institute, took 5 years and involved more than 1500 women with breast cancer and 2000 women without breast cancer; it revealed a trend between height and breast cancer: “. . . taller women have a 50 to 80 percent greater risk of getting breast cancer than women who are closer to 5 feet tall.” Christine Swanson, a nutritionist who was involved with the study, added, “. . . height may be associated with the culprit, . . . but no one really knows” the exact relationship between height and the risk of breast cancer. a. Classify this study as either an observational study or a designed experiment. Explain your answer. b. Interpret the statement made by Christine Swanson in light of your answer to part (a).arrow_forward
arrow_back_ios
SEE MORE QUESTIONS
arrow_forward_ios
Recommended textbooks for you
 MATLAB: An Introduction with ApplicationsStatisticsISBN:9781119256830Author:Amos GilatPublisher:John Wiley & Sons Inc
 Probability and Statistics for Engineering and th...StatisticsISBN:9781305251809Author:Jay L. DevorePublisher:Cengage Learning
 Statistics for The Behavioral Sciences (MindTap C...StatisticsISBN:9781305504912Author:Frederick J Gravetter, Larry B. WallnauPublisher:Cengage Learning
 Elementary Statistics: Picturing the World (7th E...StatisticsISBN:9780134683416Author:Ron Larson, Betsy FarberPublisher:PEARSON
 The Basic Practice of StatisticsStatisticsISBN:9781319042578Author:David S. Moore, William I. Notz, Michael A. FlignerPublisher:W. H. Freeman
 Introduction to the Practice of StatisticsStatisticsISBN:9781319013387Author:David S. Moore, George P. McCabe, Bruce A. CraigPublisher:W. H. Freeman
MATLAB: An Introduction with Applications
Statistics
ISBN:9781119256830
Author:Amos Gilat
Publisher:John Wiley & Sons Inc
Probability and Statistics for Engineering and th...
Statistics
ISBN:9781305251809
Author:Jay L. Devore
Publisher:Cengage Learning
Statistics for The Behavioral Sciences (MindTap C...
Statistics
ISBN:9781305504912
Author:Frederick J Gravetter, Larry B. Wallnau
Publisher:Cengage Learning
Elementary Statistics: Picturing the World (7th E...
Statistics
ISBN:9780134683416
Author:Ron Larson, Betsy Farber
Publisher:PEARSON
The Basic Practice of Statistics
Statistics
ISBN:9781319042578
Author:David S. Moore, William I. Notz, Michael A. Fligner
Publisher:W. H. Freeman
Introduction to the Practice of Statistics
Statistics
ISBN:9781319013387
Author:David S. Moore, George P. McCabe, Bruce A. Craig
Publisher:W. H. Freeman
Hypothesis Testing using Confidence Interval Approach; Author: BUM2413 Applied Statistics UMP;https://www.youtube.com/watch?v=Hq1l3e9pLyY;License: Standard YouTube License, CC-BY
Hypothesis Testing - Difference of Two Means - Student's -Distribution & Normal Distribution; Author: The Organic Chemistry Tutor;https://www.youtube.com/watch?v=UcZwyzwWU7o;License: Standard Youtube License