Concept explainers
Videos
The following data show the year-to-date percent change (YTD % Change) for 30 stock-market indexes from around the word (The Wall Street Journal, August 26, 2013).
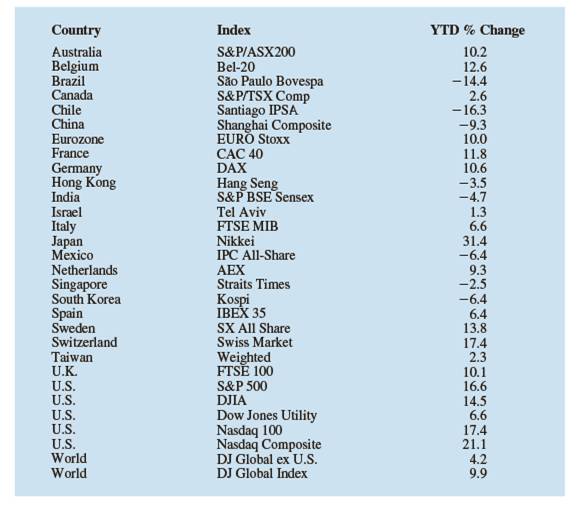
a. What index has the largest positive YTD % Change?
b. Using a class width of 5 beginning with —20 and going to 40, develop a frequency distribution for the data.
c. Prepare a histogram. Interpret the histogram, including a discussion of the general shape of the histogram.
d. Use The Wall Street Journal another media source to find the current percent changes for these stock market indexes in the current yea. Which index has had the largest percent increase? Which index has had the smallest percent decrease? Prepare a summary of the data.

Trending nowThis is a popular solution!

Chapter 2 Solutions
Essentials of Modern Business Statistics with Microsoft Office Excel (with XLSTAT Education Edition Printed Access Card) (MindTap Course List)


 Glencoe Algebra 1, Student Edition, 9780079039897...AlgebraISBN:9780079039897Author:CarterPublisher:McGraw Hill
 Holt Mcdougal Larson Pre-algebra: Student Edition...AlgebraISBN:9780547587776Author:HOLT MCDOUGALPublisher:HOLT MCDOUGAL
 Big Ideas Math A Bridge To Success Algebra 1: Stu...AlgebraISBN:9781680331141Author:HOUGHTON MIFFLIN HARCOURTPublisher:Houghton Mifflin Harcourt
 College Algebra (MindTap Course List)AlgebraISBN:9781305652231Author:R. David Gustafson, Jeff HughesPublisher:Cengage Learning