
UNIVERSE LL W/SAPLINGPLUS MULTI SEMESTER
11th Edition
ISBN: 9781319278670
Author: Freedman
Publisher: MAC HIGHER
expand_more
expand_more
format_list_bulleted
Concept explainers
Question
Chapter 22, Problem 34Q
To determine
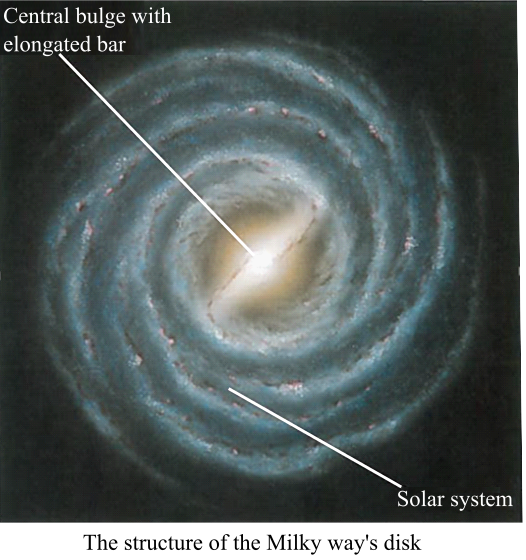
To explain: The differences between the spiral arms formed by the density waves and the spiral arms formed by the self-propagating star formation and also discuss by referring to the given figure that these processes occur in our galaxy.
Expert Solution & Answer
Want to see the full answer?
Check out a sample textbook solution
Students have asked these similar questions
Extinction dims starlight by about 1 magnitude per 1,000 pc. If one out of every 10,000 photons makes it through a dark nebula along a telescope's line of sight, what is the total extinction in magnitudes?
Chapter 22 Solutions
UNIVERSE LL W/SAPLINGPLUS MULTI SEMESTER
Ch. 22 - Prob. 1CCCh. 22 - Prob. 2CCCh. 22 - Prob. 3CCCh. 22 - Prob. 4CCCh. 22 - Prob. 5CCCh. 22 - Prob. 6CCCh. 22 - Prob. 7CCCh. 22 - Prob. 8CCCh. 22 - Prob. 9CCCh. 22 - Prob. 10CC
Ch. 22 - Prob. 11CCCh. 22 - Prob. 12CCCh. 22 - Prob. 13CCCh. 22 - Prob. 14CCCh. 22 - Prob. 1CLCCh. 22 - Prob. 2CLCCh. 22 - Prob. 1QCh. 22 - Prob. 2QCh. 22 - Prob. 3QCh. 22 - Prob. 4QCh. 22 - Prob. 5QCh. 22 - Prob. 6QCh. 22 - Prob. 7QCh. 22 - Prob. 8QCh. 22 - Prob. 9QCh. 22 - Prob. 10QCh. 22 - Prob. 11QCh. 22 - Prob. 12QCh. 22 - Prob. 13QCh. 22 - Prob. 14QCh. 22 - Prob. 15QCh. 22 - Prob. 16QCh. 22 - Prob. 17QCh. 22 - Prob. 18QCh. 22 - Prob. 19QCh. 22 - Prob. 20QCh. 22 - Prob. 21QCh. 22 - Prob. 22QCh. 22 - Prob. 23QCh. 22 - Prob. 24QCh. 22 - Prob. 25QCh. 22 - Prob. 26QCh. 22 - Prob. 27QCh. 22 - Prob. 28QCh. 22 - Prob. 29QCh. 22 - Prob. 30QCh. 22 - Prob. 31QCh. 22 - Prob. 32QCh. 22 - Prob. 33QCh. 22 - Prob. 34QCh. 22 - Prob. 35QCh. 22 - Prob. 36QCh. 22 - Prob. 37QCh. 22 - Prob. 38QCh. 22 - Prob. 39QCh. 22 - Prob. 40QCh. 22 - Prob. 41QCh. 22 - Prob. 42QCh. 22 - Prob. 43QCh. 22 - Prob. 44QCh. 22 - Prob. 45QCh. 22 - Prob. 46QCh. 22 - Prob. 47QCh. 22 - Prob. 48QCh. 22 - Prob. 49QCh. 22 - Prob. 50Q
Knowledge Booster


Learn more about
Need a deep-dive on the concept behind this application? Look no further. Learn more about this topic, physics and related others by exploring similar questions and additional content below.Similar questions
- Using the same techniques as used in Exercise 19.32, how far away can Gaia be used to measure distances with an uncertainty of 10%? What fraction of the Galactic disk does this correspond to?arrow_forwardWe have said repeatedly that blue light undergoes more extinction than red light, which is true for visible and shorter wavelengths. Is the same true for X-rays? Look at Figure 20.19. The most dust is in the galactic plane in the middle of the image, and the red color in the image corresponds to the reddest (lowestenergy) light. Based on what you see in the galactic plane, are X-rays experiencing more extinction at redder or bluer colors? You might consider comparing Figure 20.19 to Figure 20.14. Figure 20.14 Barnard 68 in Infrared. In this image, we see Barnard 68, the same object shown in Figure 20.9. The difference is that, in the previous image, the blue, green, and red channels showed light in the visible (or very nearly visible) part of the spectrum. In this image, the red color shows radiation emitted in the infrared at a wavelength of 2.2 microns. Interstellar extinction is much smaller at infrared than at visible wavelengths, so the stars behind the cloud become visible in the infrared channel. (credit: ESO) Figure 20.19 Sky in X-Rays. This image, made by the ROSAT satellite, shows the whole sky in X-rays as seen from Earth. Different colors indicate different X-ray energies: red is 0.25 kiloelectron volts, green is 0.75 kiloelectron volts, and blue is 1.5 kiloelectron volts. The image is oriented so the plane of the Galaxy runs across the middle of the image. The ubiquitous red color, which does not disappear completely even in the galactic plane, is evidence for a source of X-rays all around the Sun. (credit: modification of work by NASA)arrow_forwardHow does the presence of an active galactic nucleus in a starburst galaxy affect the starburst process?arrow_forward
- You can estimate the age of the planetary nebula in image (c) in Figure 22.18. The diameter of the nebula is 600 times the diameter of our own solar system, or about 0.8 light-year. The gas is expanding away from the star at a rate of about 25 mi/s. Considering that distance=velocitytime , calculate how long ago the gas left the star if its speed has been constant the whole time. Make sure you use consistent units for time, speed, and distance. Figure 22.18 Gallery of Planetary Nebulae. This series of beautiful images depicting some intriguing planetary nebulae highlights the capabilities of the Hubble Space Telescope. (a) Perhaps the best known planetary nebula is the Ring Nebula (M57), located about 2000 lightyears away in the constellation of Lyra. The ring is about 1 light-year in diameter, and the central star has a temperature of about 120,000 °C. Careful study of this image has shown scientists that, instead of looking at a spherical shell around this dying star, we may be looking down the barrel of a tube or cone. The blue region shows emission from very hot helium, which is located very close to the star; the red region isolates emission from ionized nitrogen, which is radiated by the coolest gas farthest from the star; and the green region represents oxygen emission, which is produced at intermediate temperatures and is at an intermediate distance from the star. (b) This planetary nebula, M2-9, is an example of a butterfly nebula. The central star (which is part of a binary system) has ejected mass preferentially in two opposite directions. In other images, a disk, perpendicular to the two long streams of gas, can be seen around the two stars in the middle. The stellar outburst that resulted in the expulsion of matter occurred about 1200 years ago. Neutral oxygen is shown in red, once-ionized nitrogen in green, and twice-ionized oxygen in blue. The planetary nebula is about 2100 light-years away in the constellation of Ophiuchus. (c) In this image of the planetary nebula NGC 6751, the blue regions mark the hottest gas, which forms a ring around the central star. The orange and red regions show the locations of cooler gas. The origin of these cool streamers is not known, but their shapes indicate that they are affected by radiation and stellar winds from the hot star at the center. The temperature of the star is about 140,000 °C. The diameter of the nebula is about 600 times larger than the diameter of our solar system. The nebula is about 6500 light-years away in the constellation of Aquila. (d) This image of the planetary nebula NGC 7027 shows several stages of mass loss. The faint blue concentric shells surrounding the central region identify the mass that was shed slowly from the surface of the star when it became a red giant. Somewhat later, the remaining outer layers were ejected but not in a spherically symmetric way. The dense clouds formed by this late ejection produce the bright inner regions. The hot central star can be seen faintly near the center of the nebulosity. NGC 7027 is about 3000 light-years away in the direction of the constellation of Cygnus. (credit a: modification of work by NASA, ESA, and the Hubble Heritage (STScI/AURA)-ESA/Hubble Collaboration; credit b: modification of work by Bruce Balick (University of Washington), Vincent Icke (Leiden University, The Netherlands), Garrelt Mellema (Stockholm University), and NASA; credit c: modification of work by NASA, The Hubble Heritage Team (STScI/AURA); credit d: modification of work by H. Bond (STScI) and NASA)arrow_forwardShapley used the positions of globular clusters to determine the location of the galactic center. Could he have used open clusters? Why or why not?arrow_forward
arrow_back_ios
arrow_forward_ios
Recommended textbooks for you
 Foundations of Astronomy (MindTap Course List)PhysicsISBN:9781337399920Author:Michael A. Seeds, Dana BackmanPublisher:Cengage Learning
 Stars and Galaxies (MindTap Course List)PhysicsISBN:9781337399944Author:Michael A. SeedsPublisher:Cengage Learning
 AstronomyPhysicsISBN:9781938168284Author:Andrew Fraknoi; David Morrison; Sidney C. WolffPublisher:OpenStax
 Horizons: Exploring the Universe (MindTap Course ...PhysicsISBN:9781305960961Author:Michael A. Seeds, Dana BackmanPublisher:Cengage Learning
 Stars and GalaxiesPhysicsISBN:9781305120785Author:Michael A. Seeds, Dana BackmanPublisher:Cengage Learning
Foundations of Astronomy (MindTap Course List)
Physics
ISBN:9781337399920
Author:Michael A. Seeds, Dana Backman
Publisher:Cengage Learning
Stars and Galaxies (MindTap Course List)
Physics
ISBN:9781337399944
Author:Michael A. Seeds
Publisher:Cengage Learning
Astronomy
Physics
ISBN:9781938168284
Author:Andrew Fraknoi; David Morrison; Sidney C. Wolff
Publisher:OpenStax
Horizons: Exploring the Universe (MindTap Course ...
Physics
ISBN:9781305960961
Author:Michael A. Seeds, Dana Backman
Publisher:Cengage Learning
Stars and Galaxies
Physics
ISBN:9781305120785
Author:Michael A. Seeds, Dana Backman
Publisher:Cengage Learning