
Concept explainers
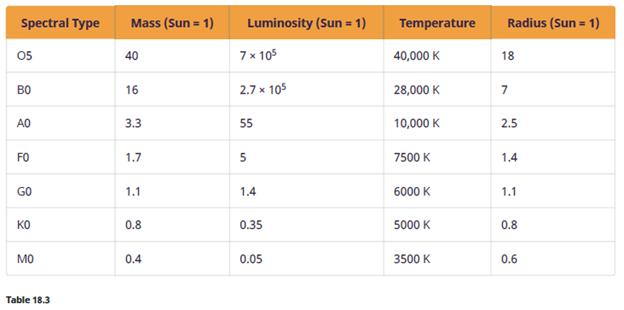
You can use the equation in Exercise 22.34 to estimate the approximate ages of the clusters in Figure 22.10, Figure 22.12, and Figure 22.13. Use the information in the figures to determine the luminosity of the most massive star still on the main sequence. Now use the data in Table 18.3 to estimate the mass of this star. Then calculate the age of the cluster. This method is similar to the procedure used by astronomers to obtain the ages of clusters, except that they use actual data and model calculations rather than simply making estimates from a drawing. How do your ages compare with the ages in the text?
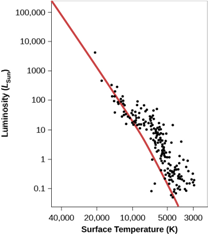
Figure 22.10 NGC 2264 H−R Diagram. Compare this H−R diagram to that in Figure 22.8; although the points scatter a bit more here, the theoretical and observational diagrams are remarkably, and satisfyingly, similar.
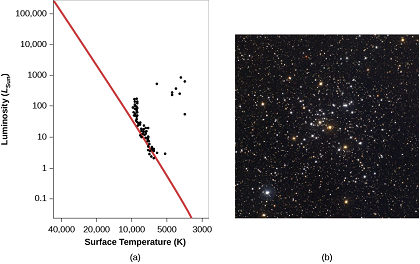
Figure 22.12 Cluster M41. (a) Cluster M41 is older than NGC 2264 (see Figure 22.10) and contains several red giants. Some of its more massive stars are no longer close to the zero-age main sequence (red line). (b) This ground-based photograph shows the open cluster M41. Note that it contains several orange-color stars. These are stars that have exhausted hydrogen in their centers, and have swelled up to become red giants. (credit b: modification of work by NOAO/AURA/NSF)
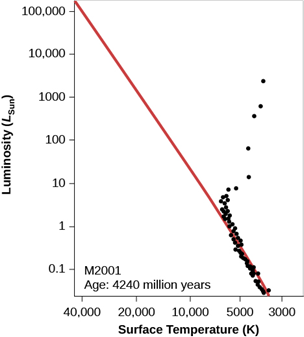
Figure 22.13 H−R Diagram for an Older Cluster. We see the H−R diagram for a hypothetical older cluster at an age of 4.24 billion years. Note that most of the stars on the upper part of the main sequence have turned off toward the red-giant region. And the most massive stars in the cluster have already died and are no longer on the diagram.
Characteristics of Main-Sequence Stars
Want to see the full answer?
Check out a sample textbook solution
Chapter 22 Solutions
Astronomy
Additional Science Textbook Solutions
Essential University Physics: Volume 2 (3rd Edition)
Conceptual Integrated Science
Life in the Universe (4th Edition)
College Physics
Introduction to Electrodynamics
The Cosmic Perspective Fundamentals (2nd Edition)


- If a 100 solar mass star were to have a luminosity of 107 times the Sun’s luminosity, how would such a star’s density compare when it is on the main sequence as an O-type star, and when it is a cool supergiant (M-type)? Use values of temperature from Figure 18.14 or Figure 18.15 and the relationship between luminosity, radius, and temperature as given in Exercise 18.47. Figure 18.15 Schematic HR Diagram for Many Stars. Ninety percent of all stars on such a diagram fall along a narrow band called the main sequence. A minority of stars are found in the upper right; they are both cool (and hence red) and bright, and must be giants. Some stars fall in the lower left of the diagram; they are both hot and dim, and must be white dwarfs. Figure 18.14 HR Diagram for a Selected Sample of Stars. In such diagrams, luminosity is plotted along the vertical axis. Along the horizontal axis, we can plot either temperature or spectral type (also sometimes called spectral class). Several of the brightest stars are identified by name. Most stars fall on the main sequence.arrow_forwardIn the HR diagrams for some young clusters, stars of both very low and very high luminosity are off to the right of the main sequence, whereas those of intermediate luminosity are on the main sequence. Can you offer an explanation for that? Sketch an HR diagram for such a cluster.arrow_forwardLook at the four stages shown in Figure 21.8. In which stage(s) can we see the star in visible light? In infrared radiation? Figure 21.8 Formation of a Star. (a) Dense cores form within a molecular cloud. (b) A protostar with a surrounding disk of material forms at the center of a dense core, accumulating additional material from the molecular cloud through gravitational attraction. (c) A stellar wind breaks out but is confined by the disk to flow out along the two poles of the star. (d) Eventually, this wind sweeps away the cloud material and halts the accumulation of additional material, and a newly formed star, surrounded by a disk, becomes observable. These sketches are not drawn to the same scale. The diameter of a typical envelope that is supplying gas to the newly forming star is about 5000 AU. The typical diameter of the disk is about 100 AU or slightly larger than the diameter of the orbit of Pluto.arrow_forward
- Describe the evolution of a star with a mass similar to that of the Sun, from the protostar stage to the time it first becomes a red giant. Give the description in words and then sketch the evolution on an HR diagram.arrow_forwardAccording to the text, a star must be hotter than about 25,000 K to produce an H II region. Both the hottest white dwarfs and main-sequence O stars have temperatures hotter than 25,000 K. Which type of star can ionize more hydrogen? Why?arrow_forwardIf the Sun were a member of the cluster NGC 2264, would it be on the main sequence yet? Why or why not?arrow_forward
- Explain how an HR diagram of the stars in a cluster can be used to determine the age of the cluster.arrow_forwardAutomobiles are often used as an analogy to help people better understand how more massive stars have much shorter main-sequence lifetimes compared to less massive stars. Can you explain such an analogy using automobiles?arrow_forwardA supernova can eject material at a velocity of 10,000 km/s. How long would it take a supernova remnant to expand to a radius of 1 AU? How long would it take to expand to a radius of 1 light-years? Assume that the expansion velocity remains constant and use the relationship: expansiontime=distanceexpansionvelocity .arrow_forward
- Describe how the mass, luminosity, surface temperature, and radius of main-sequence stars change in value going from the “bottom” to the “top” of the main sequence.arrow_forwardSuppose a star cluster were at such a large distance that it appeared as an unresolved spot of light through the telescope. What would you expect the overall color of the spot to be if it were the image of the cluster immediately after it was formed? How would the color differ after 1010 years? Why?arrow_forwardBefore the star that became SN 1987A exploded, it evolved from a red supergiant to a blue supergiant while remaining at the same luminosity. As a red supergiant, its surface temperature would have been approximately 4000 K, while as a blue supergiant, its surface temperature was 16,000 K. How much did the radius change as it evolved from a red to a blue supergiant?arrow_forward
 AstronomyPhysicsISBN:9781938168284Author:Andrew Fraknoi; David Morrison; Sidney C. WolffPublisher:OpenStax
 Foundations of Astronomy (MindTap Course List)PhysicsISBN:9781337399920Author:Michael A. Seeds, Dana BackmanPublisher:Cengage Learning
 Stars and Galaxies (MindTap Course List)PhysicsISBN:9781337399944Author:Michael A. SeedsPublisher:Cengage Learning