
Concept explainers
Videos
Olympic 5000-Meters The accompanying graph shows the winning time (in minutes) at the Olympic Games from 1952 to 2016 for the men's 5000-meterrun, together with a linear approximation of these data. (Data from: The WorldAlmanac and Book of Facts: 2017.)
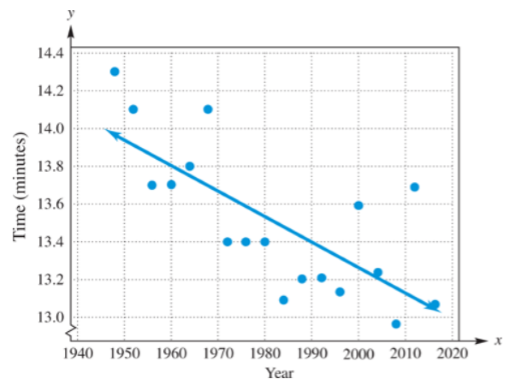
The equation for the linear approximation is
Employee Health Costs In the year 2010, the average annual cost to employees for employer family health coverage was approximately $10,000. In 2015, that amount was approximately $17000. (Data from: The Wall Street Journal.)
a. Write a linear equation expressing the average annual cost to employees y in terms of the number of years x after 2000.
b. What was the average annual cost in 2012?
c. If the trend continues, what will be the first full year in which costs exceed $25,000?
Want to see the full answer?
Check out a sample textbook solution
Chapter 2 Solutions
Mathematics with Applications In the Management, Natural, and Social Sciences (12th Edition)


- Demand for Candy Bars In this problem you will determine a linear demand equation that describes the demand for candy bars in your class. Survey your classmates to determine what price they would be willing to pay for a candy bar. Your survey form might look like the sample to the left. a Make a table of the number of respondents who answered yes at each price level. b Make a scatter plot of your data. c Find and graph the regression line y=mp+b, which gives the number of respondents y who would buy a candy bar if the price were p cents. This is the demand equation. Why is the slope m negative? d What is the p-intercept of the demand equation? What does this intercept tell you about pricing candy bars? Would you buy a candy bar from the vending machine in the hallway if the price is as indicated. Price Yes or No 50 75 1.00 1.25 1.50 1.75 2.00arrow_forwardPharmacology The numbers of prescriptions P (in thousands) filled at two pharmacies from 2012 through 2016 are shown in the table. (a) Use a graphing utility to create a scatter plot of the data for pharmacy A and find a linear model. Let t represent the year, with t=12 corresponding to 2012. Repeat the procedure for pharmacy B. (b) Assume that the models in part (a) can be used to represent future years. Will the number of prescriptions filled at pharmacy A ever exceed the number of prescriptions filled at pharmacy B? If so, when?arrow_forward
 College AlgebraAlgebraISBN:9781305115545Author:James Stewart, Lothar Redlin, Saleem WatsonPublisher:Cengage Learning
 Algebra and Trigonometry (MindTap Course List)AlgebraISBN:9781305071742Author:James Stewart, Lothar Redlin, Saleem WatsonPublisher:Cengage Learning
 Trigonometry (MindTap Course List)TrigonometryISBN:9781337278461Author:Ron LarsonPublisher:Cengage Learning
 Algebra & Trigonometry with Analytic GeometryAlgebraISBN:9781133382119Author:SwokowskiPublisher:Cengage
 Glencoe Algebra 1, Student Edition, 9780079039897...AlgebraISBN:9780079039897Author:CarterPublisher:McGraw Hill