
Mathematics with Applications In the Management, Natural, and Social Sciences (12th Edition)
12th Edition
ISBN: 9780134767628
Author: Margaret L. Lial, Thomas W. Hungerford, John P. Holcomb, Bernadette Mullins
Publisher: PEARSON
expand_more
expand_more
format_list_bulleted
Concept explainers
Videos
Textbook Question
Chapter 2.2, Problem 76E
Olympic 5000-Meters The accompanying graph shows the winning time (in minutes) at the Olympic Games from 1952 to 2016 for the men's 5000-meterrun, together with a linear approximation of these data. (Data from: The WorldAlmanac and Book of Facts: 2017.)
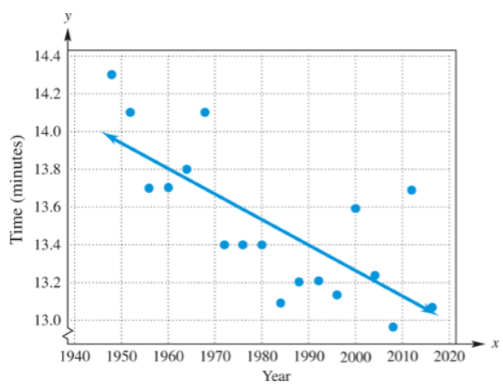
The equation for the linear approximation is
What does the slope of the line represent? Why is it negative?
Expert Solution & Answer
Want to see the full answer?
Check out a sample textbook solution
Chapter 2 Solutions
Mathematics with Applications In the Management, Natural, and Social Sciences (12th Edition)
Ch. 2.1 - Checkpoint 1
Locate and (−5,0) on a coordinate...Ch. 2.1 - Checkpoint 2
Which of the following are solutions...Ch. 2.1 - Checkpoint 3
Graph
Ch. 2.1 - Checkpoint 4
Find the x- and y-intercepts of the...Ch. 2.1 - Checkpoint 5
From Figure 2.7 determine when the...Ch. 2.1 - Checkpoint 6
In Example 6, find the profit from...Ch. 2.1 - Checkpoint 7
Use a graphing calculator to graph ...Ch. 2.1 - Checkpoint 8
Use a graphical root finder to...Ch. 2.1 - State the quadrant in which each point lies.
1.
Ch. 2.1 - State the quadrant in which each point lies.
2.
Ch. 2.1 - Determine whether the given ordered pair is a...Ch. 2.1 - Determine whether the given ordered pair is a...Ch. 2.1 - Determine whether the given ordered pair is a...Ch. 2.1 - Determine whether the given ordered pair is a...Ch. 2.1 - Prob. 7ECh. 2.1 - Prob. 8ECh. 2.1 - Prob. 9ECh. 2.1 - Prob. 10ECh. 2.1 - Prob. 11ECh. 2.1 - Prob. 12ECh. 2.1 - List the x-intercepts and y-intercepts of each...Ch. 2.1 - List the x-intercepts and y-intercepts of each...Ch. 2.1 - List the x-intercepts and y-intercepts of each...Ch. 2.1 - List the x-intercepts and y-intercepts of each...Ch. 2.1 - Find the x-intercepts and y-intercepts of the...Ch. 2.1 - Find the x-intercepts and y-intercepts of the...Ch. 2.1 - Find the x-intercepts and y-intercepts of the...Ch. 2.1 - Find the x-intercepts and y-intercepts of the...Ch. 2.1 - Find the x-intercepts and y-intercepts of the...Ch. 2.1 - Find the x-intercepts and y-intercepts of the...Ch. 2.1 - Find the x-intercepts and y-intercepts of the...Ch. 2.1 - Find the x-intercepts and y-intercepts of the...Ch. 2.1 - Find the x-intercepts and y-intercepts of the...Ch. 2.1 - Find the x-intercepts and y-intercepts of the...Ch. 2.1 - Sketch the graph of the equation. (See Examples...Ch. 2.1 - Prob. 28ECh. 2.1 - Sketch the graph of the equation. (See Examples...Ch. 2.1 - Prob. 30ECh. 2.1 - Sketch the graph of the equation. (See Examples...Ch. 2.1 - Sketch the graph of the equation. (See Examples...Ch. 2.1 - Sketch the graph of the equation. (See Examples...Ch. 2.1 - Sketch the graph of the equation. (See Examples...Ch. 2.1 - Prob. 35ECh. 2.1 - Prob. 36ECh. 2.1 - Sketch the graph of the information in the...Ch. 2.1 - Sketch the graph of the information in the...Ch. 2.1 - Sketch the graph of the information in the...Ch. 2.1 - Sketch the graph of the information in the...Ch. 2.1 - Prob. 41ECh. 2.1 - Prob. 42ECh. 2.1 - Prob. 43ECh. 2.1 - Prob. 44ECh. 2.1 - Business Use the revenue and cost graphs for the...Ch. 2.1 - Prob. 46ECh. 2.1 - Business Use the revenue and cost graphs for the...Ch. 2.1 - Prob. 48ECh. 2.1 - Business The graph below gives the annual...Ch. 2.1 - Business The graph below gives the annual...Ch. 2.1 - Prob. 51ECh. 2.1 - Prob. 52ECh. 2.1 - Netflix and Apple Stock Prices The graph below...Ch. 2.1 - Prob. 54ECh. 2.1 - Prob. 55ECh. 2.1 - Prob. 56ECh. 2.1 - Prob. 57ECh. 2.1 - Prob. 58ECh. 2.1 - Prob. 59ECh. 2.1 - Netflix and Apple stock prices The graph below...Ch. 2.1 - Netflix and Apple stock prices The graph below...Ch. 2.1 - Prob. 62ECh. 2.1 - Use a graphing calculator to find the graph of the...Ch. 2.1 - Use a graphing calculator to find the graph of the...Ch. 2.1 - Use a graphing calculator to find the graph of the...Ch. 2.1 - Use a graphing calculator to find the graph of the...Ch. 2.1 - Prob. 67ECh. 2.1 - Prob. 68ECh. 2.1 - Prob. 69ECh. 2.1 - Prob. 70ECh. 2.1 - Prob. 71ECh. 2.1 - Prob. 72ECh. 2.1 - Use a graphing calculator to approximate all real...Ch. 2.1 - Prob. 74ECh. 2.1 - Prob. 75ECh. 2.1 - Use a graphing calculator to approximate all real...Ch. 2.2 - Checkpoint 1
Find the slope of the line through...Ch. 2.2 - Checkpoint 2
Find an equation for the line...Ch. 2.2 - Prob. 3CPCh. 2.2 - Checkpoint 4
List the slopes of the following...Ch. 2.2 - Checkpoint 5
Graph the given lines and label the...Ch. 2.2 - Prob. 6CPCh. 2.2 - Checkpoint 7
Find both the point–slope and the...Ch. 2.2 - Prob. 8CPCh. 2.2 -
Checkpoint 9
The online viewership in India was...Ch. 2.2 - Find the slope of the given line, if it is...Ch. 2.2 - Find the slope of the given line, if it is...Ch. 2.2 - Prob. 3ECh. 2.2 - Find the slope of the given line, if it is...Ch. 2.2 - Prob. 5ECh. 2.2 - Find the slope of the given line, if it is...Ch. 2.2 - Find the slope of the given line, if it is...Ch. 2.2 - Prob. 8ECh. 2.2 - Find an equation of the line with the given...Ch. 2.2 - Prob. 10ECh. 2.2 - Prob. 11ECh. 2.2 - Prob. 12ECh. 2.2 - Find an equation of the line with the given...Ch. 2.2 - Prob. 14ECh. 2.2 - Prob. 15ECh. 2.2 - Find the slope m and the y-intercept b of the line...Ch. 2.2 - Prob. 17ECh. 2.2 - Prob. 18ECh. 2.2 - Find the slope m and the y-intercept b of the line...Ch. 2.2 - Find the slope m and the y-intercept b of the line...Ch. 2.2 - Prob. 21ECh. 2.2 - Prob. 22ECh. 2.2 - Prob. 23ECh. 2.2 - Prob. 24ECh. 2.2 - 25. For which of the line segments in the figure...Ch. 2.2 - 26. Match each equation with the line that most...Ch. 2.2 - Prob. 27ECh. 2.2 - Prob. 28ECh. 2.2 - Prob. 29ECh. 2.2 - Prob. 30ECh. 2.2 - Sketch the graph of the given equation and label...Ch. 2.2 - Prob. 32ECh. 2.2 - Prob. 33ECh. 2.2 - Determine whether each pair of lines is parallel,...Ch. 2.2 - Prob. 35ECh. 2.2 - Prob. 36ECh. 2.2 - Prob. 37ECh. 2.2 - Determine whether each pair of lines is parallel,...Ch. 2.2 - Prob. 39ECh. 2.2 - Prob. 40ECh. 2.2 - Find an equation of the line with slope m that...Ch. 2.2 - Prob. 42ECh. 2.2 - Prob. 43ECh. 2.2 - Prob. 44ECh. 2.2 - Prob. 45ECh. 2.2 - Prob. 46ECh. 2.2 - Prob. 47ECh. 2.2 - Prob. 48ECh. 2.2 - Find an equation of the line that passes through...Ch. 2.2 - Prob. 50ECh. 2.2 - Find an equation of the line that passes through...Ch. 2.2 - Find an equation of the line that passes through...Ch. 2.2 - Find an equation of the line satisfying the given...Ch. 2.2 - Prob. 54ECh. 2.2 - Find an equation of the line satisfying the given...Ch. 2.2 - Prob. 56ECh. 2.2 - Find an equation of the line satisfying the given...Ch. 2.2 - Prob. 58ECh. 2.2 - Prob. 59ECh. 2.2 - Prob. 60ECh. 2.2 - Find an equation of the line satisfying the given...Ch. 2.2 - Prob. 62ECh. 2.2 - Prob. 63ECh. 2.2 - Prob. 64ECh. 2.2 - Prob. 65ECh. 2.2 -
66. Ral Corp. has an incentive compensation plan...Ch. 2.2 - Prob. 67ECh. 2.2 - Prob. 68ECh. 2.2 -
Light Beer Sales Data from the Wall Street...Ch. 2.2 - Light Beer Sales Data from the Wall Street Journal...Ch. 2.2 - Global Malaria Cases Data from the Wall Street...Ch. 2.2 - Global Malaria Cases Data from the Wall Street...Ch. 2.2 - Prob. 73ECh. 2.2 - Prob. 74ECh. 2.2 - Olympic 5000-Meters The accompanying graph shows...Ch. 2.2 - Olympic 5000-Meters The accompanying graph shows...Ch. 2.2 - Olympic 5000-Meters The accompanying graph shows...Ch. 2.2 - Olympic 5000-Meters The accompanying graph shows...Ch. 2.2 - Olympic 5000-Meters The accompanying graph shows...Ch. 2.2 -
Olympic 5000-Meters The accompanying graph shows...Ch. 2.3 - Checkpoint 1
Use the points (5, 917) and (9, 1038)...Ch. 2.3 - Checkpoint 2
Another model for the data in...Ch. 2.3 - Checkpoint 3 Use the least-squares regression line...Ch. 2.3 - Checkpoint 4
Using only the data from 2005, 2007,...Ch. 2.3 - Checkpoint 5
Use only the data of 2010 and later...Ch. 2.3 - 1. Physical Science The following table shows...Ch. 2.3 - Physical Science Use the linear equation derived...Ch. 2.3 - Physical Science Use the liner equation derived in...Ch. 2.3 - Physical Science Use the linear equation derived...Ch. 2.3 - In each of the next set of problems, assume that...Ch. 2.3 - In each of the next set of problems, assume that...Ch. 2.3 - In each of the next set of problems, assume that...Ch. 2.3 - In each of the next set of problems, assume that...Ch. 2.3 -
In each of the next set of problems, assume that...Ch. 2.3 - Prob. 10ECh. 2.3 - In each of the next two problems, two linear...Ch. 2.3 -
In each of the next two problems, two linear...Ch. 2.3 - In each of the following problems, determine...Ch. 2.3 -
In each of the following problems, determine...Ch. 2.3 -
In Exercises 15-18 find the required linear...Ch. 2.3 - In Exercises 15-18 find the required linear model...Ch. 2.3 - In Exercises 15-18 find the required linear model...Ch. 2.3 - Prob. 18ECh. 2.3 - Street and Highway Construction The total amount...Ch. 2.3 - Cable Subscribers The number of basic cable...Ch. 2.3 - Prob. 21ECh. 2.3 - 22. Life Expectancy The following table shown...Ch. 2.4 - Checkpoint 1
(a) First multiply both sides of −6 <...Ch. 2.4 - Checkpoint 2
Solve these inequalities. Graph each...Ch. 2.4 - Prob. 3CPCh. 2.4 - Prob. 4CPCh. 2.4 - Prob. 5CPCh. 2.4 - Prob. 6CPCh. 2.4 - Prob. 7CPCh. 2.4 - Prob. 8CPCh. 2.4 - Prob. 9CPCh. 2.4 - Prob. 1ECh. 2.4 - 2. The three-part inequality means “p is less...Ch. 2.4 - Solve each inequality and graph each solution....Ch. 2.4 - Solve each inequality and graph each solution....Ch. 2.4 - Prob. 5ECh. 2.4 - Prob. 6ECh. 2.4 - Prob. 7ECh. 2.4 - Prob. 8ECh. 2.4 - Prob. 9ECh. 2.4 - Prob. 10ECh. 2.4 - Prob. 11ECh. 2.4 - Solve each inequality and graph each solution....Ch. 2.4 - Solve each inequality and graph each solution....Ch. 2.4 - Solve each inequality and graph each solution....Ch. 2.4 - Solve each inequality and graph each solution....Ch. 2.4 - Solve each inequality and graph each solution....Ch. 2.4 - Solve each inequality and graph each solution....Ch. 2.4 - Prob. 18ECh. 2.4 - Prob. 19ECh. 2.4 - Prob. 20ECh. 2.4 - Prob. 21ECh. 2.4 - Solve each inequality and graph each solution....Ch. 2.4 - Solve each inequality and graph each solution....Ch. 2.4 - Solve each inequality and graph each solution....Ch. 2.4 - Solve each inequality and graph each solution....Ch. 2.4 - Prob. 26ECh. 2.4 - In the following exercises, write a linear...Ch. 2.4 - In the following exercises, write a linear...Ch. 2.4 - In the following exercises, write a linear...Ch. 2.4 - In the following exercises, write a linear...Ch. 2.4 - Break-Even Point In Exercises 31-36, find all...Ch. 2.4 - Break-Even Point In Exercises 31-36, find all...Ch. 2.4 - Business In Exercises 31–36, find all values of x...Ch. 2.4 - Prob. 34ECh. 2.4 - Business In Exercises 31–36, find all values of x...Ch. 2.4 - Prob. 36ECh. 2.4 - Solve each inequality. Graph each solution. (See...Ch. 2.4 - Prob. 38ECh. 2.4 - Prob. 39ECh. 2.4 - Prob. 40ECh. 2.4 - Prob. 41ECh. 2.4 - Prob. 42ECh. 2.4 - Prob. 43ECh. 2.4 - Prob. 44ECh. 2.4 - Prob. 45ECh. 2.4 - Prob. 46ECh. 2.4 - Prob. 47ECh. 2.4 - Prob. 48ECh. 2.4 - Prob. 49ECh. 2.4 - Prob. 50ECh. 2.4 - Prob. 51ECh. 2.4 - Prob. 52ECh. 2.4 - Prob. 53ECh. 2.4 - Social Science A Gallup poll in January 2017 found...Ch. 2.4 - Prob. 55ECh. 2.4 - Prob. 56ECh. 2.5 - Checkpoint 1
Solve each inequality. Graph the...Ch. 2.5 - Prob. 2CPCh. 2.5 - Prob. 3CPCh. 2.5 - Prob. 4CPCh. 2.5 - Prob. 5CPCh. 2.5 - Prob. 6CPCh. 2.5 - Prob. 7CPCh. 2.5 - Prob. 1ECh. 2.5 - Prob. 2ECh. 2.5 - Solve each of these quadratic inequalities. Graph...Ch. 2.5 - Solve each of these quadratic inequalities. Graph...Ch. 2.5 - Prob. 5ECh. 2.5 - Prob. 6ECh. 2.5 - Prob. 7ECh. 2.5 - Prob. 8ECh. 2.5 - Solve each of these quadratic inequalities. Graph...Ch. 2.5 - Prob. 10ECh. 2.5 - Solve each of these quadratic inequalities. Graph...Ch. 2.5 - Prob. 12ECh. 2.5 - Solve these inequalities. (See Example 4.) 13.
Ch. 2.5 - Solve these inequalities. (See Example 4.) 14.
Ch. 2.5 - Prob. 15ECh. 2.5 - Prob. 16ECh. 2.5 - Solve these inequalities. (See Example 4.)
17.
Ch. 2.5 - Prob. 18ECh. 2.5 - Prob. 19ECh. 2.5 - Prob. 20ECh. 2.5 - 21. A student solved the inequality by taking...Ch. 2.5 - Prob. 22ECh. 2.5 - Use a graphing calculator to solve these...Ch. 2.5 - Use a graphing calculator to solve these...Ch. 2.5 - Prob. 25ECh. 2.5 - Prob. 26ECh. 2.5 - Prob. 27ECh. 2.5 - Prob. 28ECh. 2.5 - Solve these rational inequalities. (See Examples 7...Ch. 2.5 - Prob. 30ECh. 2.5 - Prob. 31ECh. 2.5 - Prob. 32ECh. 2.5 - Prob. 33ECh. 2.5 - Prob. 34ECh. 2.5 - Prob. 35ECh. 2.5 - Solve these rational inequalities. (See Examples 7...Ch. 2.5 - Solve these rational inequalities. (See Examples 7...Ch. 2.5 - Prob. 38ECh. 2.5 - Prob. 39ECh. 2.5 - Prob. 40ECh. 2.5 - 41. Business An analyst has found that her...Ch. 2.5 - Prob. 42ECh. 2.5 - Prob. 43ECh. 2.5 - Prob. 44ECh. 2 - Which of the ordered pairs (−2, 3), (0, −5), (2,...Ch. 2 - Prob. 2RECh. 2 - Sketch the graph of each equation. 3.
Ch. 2 - Prob. 4RECh. 2 - Sketch the graph of each equation. 5.
Ch. 2 - Prob. 6RECh. 2 - Prob. 7RECh. 2 - Prob. 8RECh. 2 - Prob. 9RECh. 2 - Prob. 10RECh. 2 - Prob. 11RECh. 2 - Prob. 12RECh. 2 - In Exercises 12–21, find the slope of the line...Ch. 2 - Prob. 14RECh. 2 - Prob. 15RECh. 2 - Prob. 16RECh. 2 - In Exercises 12–21, find the slope of the line...Ch. 2 - Prob. 18RECh. 2 - In Exercises 12–21, find the slope of the line...Ch. 2 - In Exercises 12–21, find the slope of the line...Ch. 2 - In Exercises 12–21, find the slope of the line...Ch. 2 - Prob. 22RECh. 2 - 23. Graph the line through (−4, 1) with m = 3.
Ch. 2 - 24. What information is needed to determine the...Ch. 2 - Find an equation for each of the following...Ch. 2 - Prob. 26RECh. 2 - Find an equation for each of the following...Ch. 2 - Find an equation for each of the following...Ch. 2 - Prob. 29RECh. 2 - Prob. 30RECh. 2 - Find an equation for each of the following...Ch. 2 - 32. Here is a sample SAT question: Which of the...Ch. 2 - Student Loans In 2010, the total owed on federal...Ch. 2 - Prob. 34RECh. 2 - Median Income The following table gives the median...Ch. 2 - Prob. 36RECh. 2 - Two-Year School Tuition The following table shows...Ch. 2 - 38. Four-Year School Tuition The following table...Ch. 2 - Solve each inequality. 39.
Ch. 2 - Solve each inequality. 40.
Ch. 2 - Solve each inequality. 41.
Ch. 2 - Solve each inequality. 42.
Ch. 2 - Solve each inequality. 43.
Ch. 2 - Solve each inequality. 44.
Ch. 2 - Solve each inequality. 45.
Ch. 2 - Solve each inequality. 46.
Ch. 2 - Solve each inequality. 47.
Ch. 2 - Solve each inequality. 48.
Ch. 2 - Solve each inequality. 49.
Ch. 2 - Solve each inequality. 50.
Ch. 2 - Prob. 51RECh. 2 - Prob. 52RECh. 2 - Prob. 53RECh. 2 - 54. Business One car rental firm charges $125 for...Ch. 2 - Solve each inequality. 55.
Ch. 2 - Solve each inequality. 56.
Ch. 2 - Solve each inequality. 57
Ch. 2 - Solve each inequality. 58.
Ch. 2 - Solve each inequality. 59.
Ch. 2 - Solve each inequality. 60.
Ch. 2 - Solve each inequality.
61.
Ch. 2 - Solve each inequality.
62.
Ch. 2 - Solve each inequality.
63.
Ch. 2 - Solve each inequality.
64.
Ch. 2 - Solve each inequality.
65.
Ch. 2 - Solve each inequality.
66.
Ch. 2 - Business The following table gives the number of...Ch. 2 - Business The following table gives the number of...Ch. 2 - Prob. 5CECh. 2 - Prob. 6CECh. 2 - Prob. 7CECh. 2 - Prob. 8CECh. 2 - Prob. 9CECh. 2 - Prob. 1EPCh. 2 - Prob. 2EPCh. 2 - Prob. 3EPCh. 2 - Prob. 4EPCh. 2 - Prob. 5EP
Knowledge Booster


Learn more about
Need a deep-dive on the concept behind this application? Look no further. Learn more about this topic, subject and related others by exploring similar questions and additional content below.Similar questions
- The number y (in thousands) of male participants in high school lacrosse in the United States from 2008 through 2015 can be approximated by the linear model y=3.66t+91.4,2t5 where t represents the year, with t=0 corresponding to 2010. (a) Find algebraically and interpret the y-intercept of the graph of the linear model. (b) Use the linear model to predict the year in which there will be 128,000 male participants.arrow_forwardNeurology The average weight of a male child’s brain is 970 grams at age 1 and 1270 grams at age 3. (a) Assuming that the relationship between brain weight y and age t is linear, write a linear model for the data. (b) What is the slope and what does it tell you about brain weight? (c) Use your model to estimate the average brain weight at age 2. (d) Use your school’s library, the Internet, or some other reference source to find the actual average brain weight at age 2. How close was your estimate? (e) (d) Do you think your model could be used to determine the average brain weight of an adult? Explain.arrow_forwardDemand for Candy Bars In this problem you will determine a linear demand equation that describes the demand for candy bars in your class. Survey your classmates to determine what price they would be willing to pay for a candy bar. Your survey form might look like the sample to the left. a Make a table of the number of respondents who answered yes at each price level. b Make a scatter plot of your data. c Find and graph the regression line y=mp+b, which gives the number of respondents y who would buy a candy bar if the price were p cents. This is the demand equation. Why is the slope m negative? d What is the p-intercept of the demand equation? What does this intercept tell you about pricing candy bars? Would you buy a candy bar from the vending machine in the hallway if the price is as indicated. Price Yes or No 50 75 1.00 1.25 1.50 1.75 2.00arrow_forward
- Rage of growth When a college started an aviation program, the administration agreed to predict enrollments using a straight-line method. If the enrollment during the first year was 14, and the enrollment during the fifth year was 42, find the average rate of growth per year was 42, find the average rate of growth per year the slope of the line. See the illustration.arrow_forwardManufacturing Cost The manager of a furniture factory finds that it costs 2200 to produce 100 chairs in one day and 4800 to produce 300 chairs in one day. a Assuming that the relationship between cost and the number of chairs produced is linear, find a linear function C that models the cost of producing x chairs in one day. b Draw a graph of C. What is the slope of this line? c At what rate does the factorys cost increase for every additional chair produced?arrow_forwardSuppose that average annual income (in dollars) forthe years 1990 through 1999 is given by the linearfunction: I(x)=1,054x+23,286 , where x is thenumber of years after 1990. Which of the followinginterprets the slope in the context of the problem? a. As of 1990, average annual income was $23,286. b. In the ten-year period from 1990-1999, averageannual income increased by a total of $1,054. c. Each year in the decade of the 1990s, averageannual income increased by $1,054. d. Average annual income rose to a level of $23,286 bythe end of 1999.arrow_forward
- Cost of Adding Employees The following table shows the cost, in millions of dollars, to Walmart of adding the given number of employees to each of its superstores.14 E = number of new employees 1 2 3 4 C = cost 89.6 179.2 268.8 358.4 a. Find a linear model for the data in the table. b. Explain in practical terms the meaning of the slope of the linear model you found in part a.arrow_forwardEmployee Turnover The percentage of employees who cease their employment during a year is referred to as employee turnover, and it is a serious issue for businesses. The following table shows the cost, in millions of dollars, to Walmart for a given employee turnover percentage in a year.13 E = employee turnover 10 20 30 40 C = cost 250 400 550 700 a. Show that the data can be modeled by a linear function. b. Find the slope of the linear function. c. Find a linear model for the data. d. Use the result from part c to find the cost to Walmart if employee turnover is 33 in a year.arrow_forward
arrow_back_ios
arrow_forward_ios
Recommended textbooks for you
 College AlgebraAlgebraISBN:9781305115545Author:James Stewart, Lothar Redlin, Saleem WatsonPublisher:Cengage Learning
 Algebra and Trigonometry (MindTap Course List)AlgebraISBN:9781305071742Author:James Stewart, Lothar Redlin, Saleem WatsonPublisher:Cengage Learning
 College Algebra (MindTap Course List)AlgebraISBN:9781305652231Author:R. David Gustafson, Jeff HughesPublisher:Cengage Learning
 Functions and Change: A Modeling Approach to Coll...AlgebraISBN:9781337111348Author:Bruce Crauder, Benny Evans, Alan NoellPublisher:Cengage Learning
 Glencoe Algebra 1, Student Edition, 9780079039897...AlgebraISBN:9780079039897Author:CarterPublisher:McGraw Hill
College Algebra
Algebra
ISBN:9781305115545
Author:James Stewart, Lothar Redlin, Saleem Watson
Publisher:Cengage Learning
Algebra and Trigonometry (MindTap Course List)
Algebra
ISBN:9781305071742
Author:James Stewart, Lothar Redlin, Saleem Watson
Publisher:Cengage Learning
College Algebra (MindTap Course List)
Algebra
ISBN:9781305652231
Author:R. David Gustafson, Jeff Hughes
Publisher:Cengage Learning
Functions and Change: A Modeling Approach to Coll...
Algebra
ISBN:9781337111348
Author:Bruce Crauder, Benny Evans, Alan Noell
Publisher:Cengage Learning
Glencoe Algebra 1, Student Edition, 9780079039897...
Algebra
ISBN:9780079039897
Author:Carter
Publisher:McGraw Hill
What is a Linear Equation in One Variable?; Author: Don't Memorise;https://www.youtube.com/watch?v=lDOYdBgtnjY;License: Standard YouTube License, CC-BY
Linear Equation | Solving Linear Equations | What is Linear Equation in one variable ?; Author: Najam Academy;https://www.youtube.com/watch?v=tHm3X_Ta_iE;License: Standard YouTube License, CC-BY