
Concept explainers
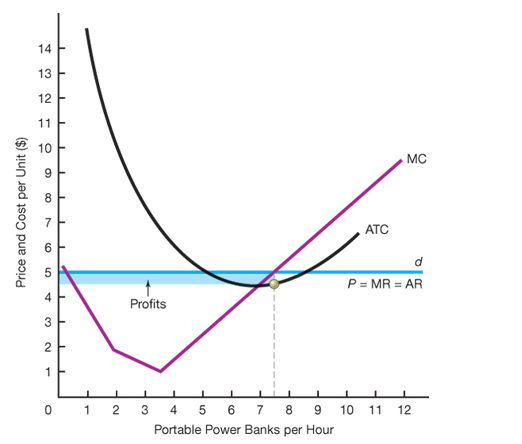
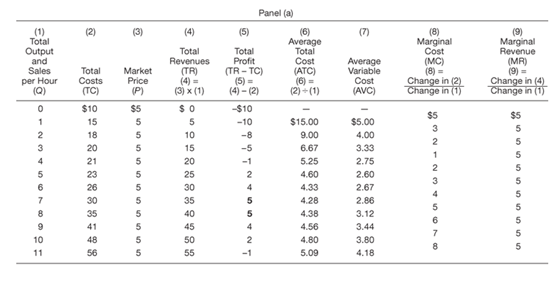
Take a look at the below graph. This graph uses the data from the below table which indicates that the 5area of the blue rectangle displaying hourly economic profits of $5 per period. What prevents this firm from continuing to produce the same number of units per hour but raising the price that it charges for each unit in order to enlarge the area of the profit rectangle?

Concept Introduction:
In
Economic profit: The economic profit of a firm is calculated by deducting total revenue from total cost. The total costs consists of both implicit and explicit costs. Explicit cost is the ordinary costs of the firm like rent, salaries to the employees etc. Implicit cost is also known as imputed cost which describes as the
Want to see the full answer?
Check out a sample textbook solution
Chapter 23 Solutions
ECONOMICS TODAY: MICRO VIEW >CUSTOM<


 Principles of Economics (12th Edition)EconomicsISBN:9780134078779Author:Karl E. Case, Ray C. Fair, Sharon E. OsterPublisher:PEARSON
 Engineering Economy (17th Edition)EconomicsISBN:9780134870069Author:William G. Sullivan, Elin M. Wicks, C. Patrick KoellingPublisher:PEARSON
 Principles of Economics (MindTap Course List)EconomicsISBN:9781305585126Author:N. Gregory MankiwPublisher:Cengage Learning
 Managerial Economics: A Problem Solving ApproachEconomicsISBN:9781337106665Author:Luke M. Froeb, Brian T. McCann, Michael R. Ward, Mike ShorPublisher:Cengage Learning
 Managerial Economics & Business Strategy (Mcgraw-...EconomicsISBN:9781259290619Author:Michael Baye, Jeff PrincePublisher:McGraw-Hill Education