
Understandable Statistics: Concepts and Methods
12th Edition
ISBN: 9781337119917
Author: Charles Henry Brase, Corrinne Pellillo Brase
Publisher: Cengage Learning
expand_more
expand_more
format_list_bulleted
Concept explainers
Videos
Textbook Question
Chapter 2.3, Problem 1P
Cowboys: Longevity How long did real cowboys live? One answer may be found in the book The Last Cowboys by Connie Brooks (University of New Mexico Press). This delightful book presents a thoughtful sociological study of cowboys in west Texas and southeastern New Mexico around the year 1890. A sample of 32 cowboys gave the following years of longevity:
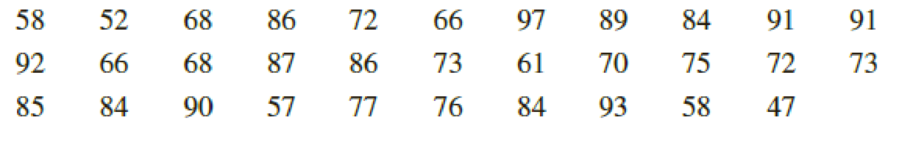
- (a) Make a stem-and-leaf display for these data.
- (b) Interpretation Consider the following quote from Baron von Richthofen in his Cattle Raising on the Plains of North America: “Cowboys are to be found among the sons of the best families. The truth is probably that most were not a drunken, gambling lot, quick to draw and fire their pistols.” Does the data distribution of longevity lend credence to this quote?
Expert Solution & Answer
Want to see the full answer?
Check out a sample textbook solution
Chapter 2 Solutions
Understandable Statistics: Concepts and Methods
Ch. 2.1 - Statistical Literacy What is the difference...Ch. 2.1 - Statistical Literacy A data set has values ranging...Ch. 2.1 - Statistical Literacy A data set has values ranging...Ch. 2.1 - Prob. 4PCh. 2.1 - Basic Computation: Class Limits A data set with...Ch. 2.1 - Prob. 6PCh. 2.1 - Interpretation You are manager of a specialty...Ch. 2.1 - Prob. 8PCh. 2.1 - Critical Thinking Look at the histogram in Figure...Ch. 2.1 - Critical Thinking The following data represent...
Ch. 2.1 - Interpretation Histograms of random sample data...Ch. 2.1 - Prob. 12PCh. 2.1 - Interpretation The ogives shown are based on U.S....Ch. 2.1 - Prob. 14PCh. 2.1 - For Problems 15-20, use the specified number of...Ch. 2.1 - For Problems 15-20, use the specified number of...Ch. 2.1 - For Problems 15-20, use the specified number of...Ch. 2.1 - Prob. 18PCh. 2.1 - For Problems 15-20, use the specified number of...Ch. 2.1 - Prob. 20PCh. 2.1 - Expand Your Knowledge: Decimal Data The following...Ch. 2.1 - Decimal Data: Batting Averages The following data...Ch. 2.1 - Expand Your Knowledge: Dotplot Another display...Ch. 2.1 - Prob. 24PCh. 2.1 - Dotplot: Tumor Recurrence Make a dotplot for the...Ch. 2.2 - Interpretation Consider graph (a) of Reasons...Ch. 2.2 - Reasons People Like Texting on Cell Phones (b)...Ch. 2.2 - Critical Thinking A personnel office is gathering...Ch. 2.2 - Prob. 4PCh. 2.2 - Education: Does College Pay Off? It is costly in...Ch. 2.2 - Prob. 6PCh. 2.2 - Commercial Fishing: Gulf of Alaska Its not an easy...Ch. 2.2 - Prob. 8PCh. 2.2 - Lifestyle: Hide the Mess! A survey of 1000 adults...Ch. 2.2 - Prob. 10PCh. 2.2 - FBI Report: Hawaii In the Aloha state, you are...Ch. 2.2 - Prob. 12PCh. 2.2 - Prob. 13PCh. 2.2 - Prob. 14PCh. 2.2 - Prob. 15PCh. 2.2 - Prob. 16PCh. 2.3 - Cowboys: Longevity How long did real cowboys live?...Ch. 2.3 - Ecology: Habitat Wetlands offer a diversity of...Ch. 2.3 - Health Care: Hospitals The American Medical...Ch. 2.3 - Health Care: Hospitals Using the number of...Ch. 2.3 - Expand Your Knowledge: Split Stem The Boston...Ch. 2.3 - Prob. 6PCh. 2.3 - Prob. 7PCh. 2.3 - Prob. 8PCh. 2.3 - Prob. 9PCh. 2.3 - Prob. 10PCh. 2 - Prob. 1CRPCh. 2 - Critical Thinking A consumer interest group is...Ch. 2 - Prob. 3CRPCh. 2 - Prob. 4CRPCh. 2 - Prob. 5CRPCh. 2 - Prob. 6CRPCh. 2 - Prob. 7CRPCh. 2 - Prob. 8CRPCh. 2 - Prob. 9CRPCh. 2 - Prob. 10CRPCh. 2 - Prob. 11CRPCh. 2 - Prob. 12CRPCh. 2 - Prob. 1DHCh. 2 - Prob. 2DHCh. 2 - In your own words, explain the differences among...Ch. 2 - What do we mean when we say a histogram is skewed...Ch. 2 - Discuss the statement that stem-and-leaf displays...Ch. 2 - Prob. 1UTCh. 2 - Prob. 2UTCh. 2 - Prob. 3UT
Knowledge Booster


Learn more about
Need a deep-dive on the concept behind this application? Look no further. Learn more about this topic, statistics and related others by exploring similar questions and additional content below.Similar questions
- Urban Travel Times Population of cities and driving times are related, as shown in the accompanying table, which shows the 1960 population N, in thousands, for several cities, together with the average time T, in minutes, sent by residents driving to work. City Population N Driving time T Los Angeles 6489 16.8 Pittsburgh 1804 12.6 Washington 1808 14.3 Hutchinson 38 6.1 Nashville 347 10.8 Tallahassee 48 7.3 An analysis of these data, along with data from 17 other cities in the United States and Canada, led to a power model of average driving time as a function of population. a Construct a power model of driving time in minutes as a function of population measured in thousands b Is average driving time in Pittsburgh more or less than would be expected from its population? c If you wish to move to a smaller city to reduce your average driving time to work by 25, how much smaller should the city be?arrow_forwardJob Applicants A small college needs two additional faculty members: a chemist and a statistician. There are five applicants for the chemistry position and three applicants for the statistics position. In how many ways can the college fill these positions?arrow_forward
Recommended textbooks for you
 Linear Algebra: A Modern IntroductionAlgebraISBN:9781285463247Author:David PoolePublisher:Cengage Learning
 Functions and Change: A Modeling Approach to Coll...AlgebraISBN:9781337111348Author:Bruce Crauder, Benny Evans, Alan NoellPublisher:Cengage Learning
 Glencoe Algebra 1, Student Edition, 9780079039897...AlgebraISBN:9780079039897Author:CarterPublisher:McGraw Hill
Linear Algebra: A Modern Introduction
Algebra
ISBN:9781285463247
Author:David Poole
Publisher:Cengage Learning
Functions and Change: A Modeling Approach to Coll...
Algebra
ISBN:9781337111348
Author:Bruce Crauder, Benny Evans, Alan Noell
Publisher:Cengage Learning
Glencoe Algebra 1, Student Edition, 9780079039897...
Algebra
ISBN:9780079039897
Author:Carter
Publisher:McGraw Hill
The Shape of Data: Distributions: Crash Course Statistics #7; Author: CrashCourse;https://www.youtube.com/watch?v=bPFNxD3Yg6U;License: Standard YouTube License, CC-BY
Shape, Center, and Spread - Module 20.2 (Part 1); Author: Mrmathblog;https://www.youtube.com/watch?v=COaid7O_Gag;License: Standard YouTube License, CC-BY
Shape, Center and Spread; Author: Emily Murdock;https://www.youtube.com/watch?v=_YyW0DSCzpM;License: Standard Youtube License