
(a)
Interpretation:
The Ca2+ concentration in the inner solution of electrode 2 should be determined.
Concept introduction:
Nernst equation gives the cell potential under non-standard conditions.
E − cell potential
E0 − standard cell potential
R − universal gas constant
T − temperature in Kelvin
n − number of electrons transferred
F − Faraday constant
Q − Reaction quotient
Answer to Problem 23.27QAP
Explanation of Solution
The given reactions are represented as follows:
The equilibrium constant can be calculated as follows:
Here,
If x mol/L of Ca-EDTA complex is dissociated.
(b)
Interpretation:
The ionic strength of the solution in Electrode 2 should be determined.
Concept introduction:
The ionic strength can be calculated as follows:
Here,
µ − ionic strength
c − molar concentrations of the ions
Z − charge on the ion.
Answer to Problem 23.27QAP
Explanation of Solution
On putting the respective molar concentrations of ions and charge on the ion, the ionic strength can be calculated as follows:
(c)
Interpretation:
The activity of Ca2+ in electrode 2 should be determined.
Concept introduction:
The activity of coefficient of species A can be calculated as follows:
Here,
Answer to Problem 23.27QAP
Explanation of Solution
The activity of coefficient of species A can be calculated as follows:
Also,
(d)
Interpretation:
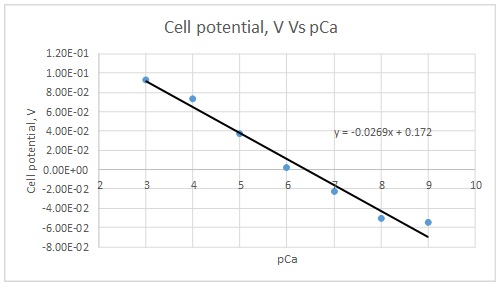
The cell potential versus the pCa should be plotted and pCa value where the plot deviated more than 5% from linearity should be determined. For the linear portion, the slope and the intercept should be determined.
Concept introduction:
For cations,
Here,
K − constant
n − number of moles of electrons
X − activity of the cation.
Answer to Problem 23.27QAP
At
Slope = -0.0298
Intercept =0.185733
The plot obeys the equation 23-29.
Explanation of Solution
The data given is as follows:
| Activity of Ca2+, M | pCa | Cell potential, V |
| 1.00E-03 | 3 | 9.30E-02 |
| 1.00E-04 | 4 | 7.30E-02 |
| 1.00E-05 | 5 | 3.70E-02 |
| 1.00E-06 | 6 | 2.00E-03 |
| 1.00E-07 | 7 | -2.30E-02 |
| 1.00E-08 | 8 | -5.10E-02 |
| 1.00E-09 | 9 | 5.50E-02 |
The plot is represented as follows:
At
Let’s draw the graph eliminating this value.
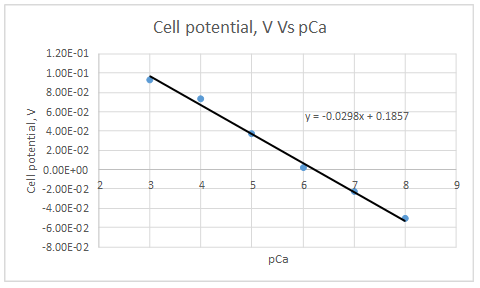
According to the linear regression analysis done in a spread sheet,
Slope = -0.0298
Intercept =0.185733
According to the equation 23.29,
Therefore, the plot obeys the equation 23-29.
(e)
Interpretation:
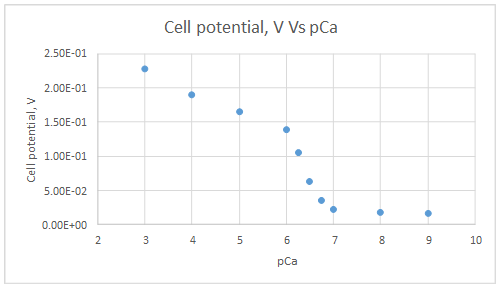
The cell potential versus the pCa should be plotted for electrode 2 and the range of linearity should be determined. For the linear portion, the slope and the intercept should be determined.
Concept introduction:
For cations,
Here,
K − constant
n − number of moles of electrons
X − activity of the cation.
Answer to Problem 23.27QAP
Range of linearity is from pCa 3 to 6
Slope = -0.0292
Intercept = 0.3119
This electrode obeys the equation 23-29 for higher Ca2+ activities
Explanation of Solution
The data given is as follows:
| Activity of Ca2+, M | pCa | Cell potential, V |
| 1.00E-03 | 3 | 2.28E-01 |
| 1.00E-04 | 4 | 1.90E-01 |
| 1.00E-05 | 5 | 1.65E-01 |
| 1.00E-06 | 6 | 1.39E-01 |
| 5.60E-07 | 6.25181197 | 1.05E-01 |
| 3.20E-07 | 6.49485002 | 6.30E-02 |
| 1.80E-07 | 6.74472749 | 3.60E-02 |
| 1.00E-07 | 7 | 2.30E-02 |
| 1.00E-08 | 8 | 1.80E-02 |
| 1.00E-09 | 9 | 1.70E-02 |
The graph is plotted as follows:
Range of linearity is from pCa 3 to 6
Let’s draw the graph eliminating non-linear values.
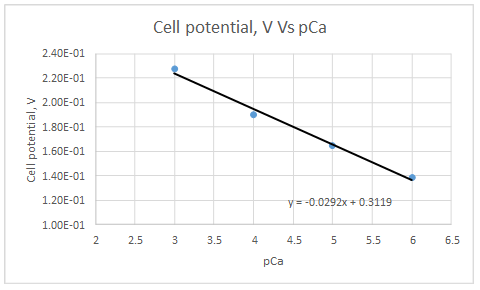
According to the linear regression analysis done in a spread sheet,
Slope = -0.0292
Intercept = 0.3119
This electrode obeys the equation 23-29 for higher Ca2+ activities.
(f)
Interpretation:
The reason for the term super-Nernstianto be used for electrode 2 should be discussed.
Concept introduction:
Electrode 2 has an inner solution with low activities of Ca2+.
Answer to Problem 23.27QAP
A super-Nernstian response is a result of an inward flux of ions which are to be analyzed.
Explanation of Solution
As a result of a super-Nernstian response, an inward flux of ions, Ca2+ in this case needed to be analyzed into the ion-selective membrane. In the diffusion layer, it decreases Ca2+ ions at the sample-membrane phase boundary. When there is low Ca2+ ions concentration, this super-Nernstian behavior usually takes place. It is usually experienced at concentrations at or below 1 × 10⁻⁶ M.
(g)
Interpretation:
The cell potential versus the pCa should be plotted and the range of linearity should be determined. For the linear portion, the slope and the intercept should be determined.
Concept introduction:
For cations,
Here,
K − constant
n − number of moles of electrons
X − activity of the cation.
Answer to Problem 23.27QAP
Range of linearity is between pCa 3 to 6
Slope = -0.0288
Intercept = 0.2636
The plot obeys the equation 23-29 at higher concentrations.
Explanation of Solution
| Activity of Ca2+, M | pCa | Cell potential, V |
| 1.00E-03 | 3 | 1.75E-01 |
| 1.00E-04 | 4 | 1.50E-01 |
| 1.00E-05 | 5 | 1.23E-01 |
| 1.00E-06 | 6 | 8.80E-02 |
| 1.00E-07 | 7 | 7.50E-02 |
| 1.00E-08 | 8 | 7.20E-02 |
| 1.00E-09 | 9 | 7.10E-02 |
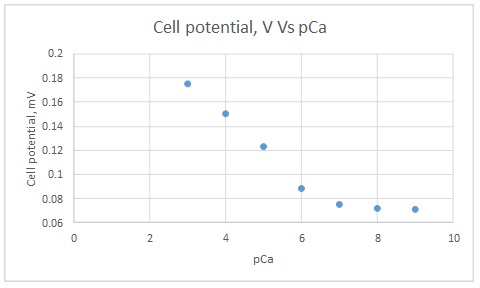
Range of linearity is between pCa 3 to 6.
Let’s draw the graph eliminating non-linear values.
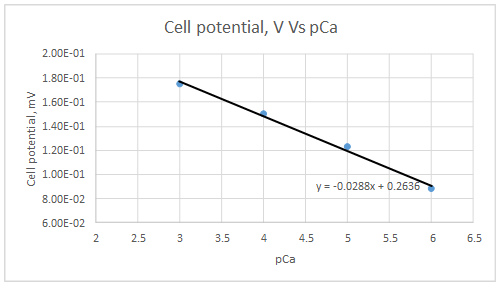
According to the linear regression analysis done in a spread sheet,
Slope = -0.0288
Intercept = 0.2636
According to the equation 23.29,
Therefore, the plot obeys the equation 23-29 at higher concentrations.
(h)
Interpretation:
Electrode 3 is said to have Ca2+ release. This term should be explained.
Concept introduction:
Electrode 3 has an inner solution with higher activities of Ca2+.
Answer to Problem 23.27QAP
When the concentration of Ca2+ in the solution is too low than that of inner solution of the electrode, Ca2+ flux outward to the solution through diffusion.
Explanation of Solution
Ca2+ is a result of an outward flux of ions which are to be analyzed, in this case Ca2+ ions out of the ion-selective membrane. This results in increase of Ca2+ ions in the diffusion layer at the sample-membrane phase boundary. This Ca2+ release usually happens when there is a low concentration of Ca2+ ions in the solution to be analyzed.
(i)
Interpretation:
The alternative explanations for experimental results given in the article should be described.
Concept introduction:
An
Answer to Problem 23.27QAP
The reason for super-Nernstian response is that at low sample activities, the gradient required to maintain the membrane flux is no more negligible relative to the bulk. Ca2+ uptake is a result of the strong coextraction of Ca(NO3)2 into the membrane.
Explanation of Solution
The emf observed with ISE are a logarithmic function of the bulk sample activities. Deviation from this behavior can be explained either by activity change in the organic membrane surface layer or by differences between sample activities in the bulk and the membrane surface layer. Deviation are a result of ions release from or uptake to the membrane. These ion fluxes originate from concentration polarization within the membrane, asymmetrical ion exchange and coextraction reactions at both membrane sides.
The reason for super-Nernstian response is that at low sample activities, the gradient required to maintain the membrane flux is no more negligible relative to the bulk. Ca2+ uptake is a result of the strong coextraction of Ca(NO3)2 into the membrane.
Want to see more full solutions like this?
Chapter 23 Solutions
Principles of Instrumental Analysis

- 1. A sample of an infusion was diluted 10 ml to 250 ml and then 10 ml to 200 ml. It was then analysed and was found to contain sodium at 0.789 mg/100 ml. Calculate the concentration of sodium in the original sample in %w/v. The sample was composed of a mixture of sodium lactate and sodium carbonate in equimolar amounts. Calculate the amount of sodium lactate and sodium carbonate in mg/10 ml of the sample (Na = 23, lactate = 89, carbonate = 60) 2. 0.641 g of a semi-synthetic alkaloid was dissolved in 25 ml of 1% w/v acetic acid and was analysed directly by HPLC. The solution was found to contain 1.42 mg/100 ml of an impurity. What is the level of impurity in % w/w and ppm? 3. Calculate the pH of a buffer system made by dissolving 1.2 g of acetic acid and 0.82 g of sodium acetate in 500 ml of distilled water (pKa of acetic acid = 4.7) 4. Convert the following concentrations into the required expression. Concentration given Expression required 0.5% NaCl molarity 1 mM of KBr…arrow_forwardWhich of the following electrochemical methods requires the formation and measurement of an insoluble form of the analyte? I. coulometry II. voltammetry III. potentiometry IV. electrogravimetry a. IV onlyb. I and IVc. I and IId. I, II and IVe. I, II, III and IVarrow_forwardGiven the following activity coefficient data: Ion Ion Size (pm) Ionic Strength (μ, M) 0.001 0.005 0.01 0.05 0.1 Zn2+ 600 0.870 0.749 0.675 0.485 0.405 Calculate the ionic strength of a solution that is 0.0213 M Mg(CN)2. Based on your results in part 1, what is the activity coefficient of Zn2+? 3. Zinc cyanide, Zn(CN)2, has a Ksp of 3.0 x 10⁻¹⁶. Using the activity coefficient you calculated in part 2, find the concentration of Zn2+ in a saturated solution of Zn(CN)2 in 0.0213 M Mg(CN)2. (Note: The activity coefficient for cyanide in at this ionic strength is 0.791.)arrow_forward
- 0.5M HA sample with 0.2 dissociation; It is placed in a conductivity cell with a length of 0.9 cm and an area of 2 cm2 and its conductivity is read as 300 mS. For this purpose;a) Equivalent conductivity of the electrolyte ?b) Boundary equivalent conductivity ?c) Decomposition constant ?arrow_forwardAn ion selective electrode is utilised to determine the concentration of Ca2+ in the presence of Mg2+. The selectivity coefficient for the electrode kij is 0.015. If the concentrations of Ca2+ and Mg2+ are 50 and 500 ppm, respectively, calculate the change in potential (in mV) when the temperature of the measurement cell is increased from 20oC to 40oC.arrow_forwardTraces of aniline can be determined by reaction with an excess of electrolytically generated Br2: C6H5NH2 + 3Br2 =====è C6H2Br3NH2 + 3H+ + 3Br- The polarity of the working electrode is then reversed, and the excess bromine is determined by a coulometric titration involving the generation of Cu(I): Br2 + 2Cu+ ===è 2Br- + 2Cu2+ Suitbale quantities of KBr and copper (II) sulfate were added to a 25.0 ml sample containing aniline (C6H5NH2). Calculate the mass in micrograms of C6H5NH2 in the sample from the accompanying data. Working electrode Functioning as Generation Time (min) with a constant current of 1.00 mA Anode 3.76 cathode 0.270arrow_forward
- A 0.2653 g of pure potassium dichromate was dissolved in 15 mL of 1.5 M sulfuric acid and transferred to a 250.0 mL volumetric flask and diluted to the mark with distilled water. A 25.0 mL aliquot of this solution was transferred to another 250.0 mL volumetric flask and diluted to the mark with distilled water and this solution has an absorbance 0f 0.387 in a 2.00 cm cell. Calculate the molar absorptivity of potassium dichromate.arrow_forwardThe permeabilities and ion concentrations are shown below for a squid giant axon at resting potential, Em. Na+ K+ Cl- Concentration out(mM) 463 10 592 Concentration in(mM) 49 340 114 Permeability(10-8 cm/s) 3.5 45 7.3 (a) What is the Nernst potential for Na+? mV(a) What is the Nernst potential for K+? mV(a) What is the Nernst potential for Cl-? mV(a) What is the membrane potential Em according to the Goldman equation?arrow_forwardWhich is not an error associated with an incorrectly defined pH measurement? A) contact potential deviation-AgCl or Ag precipitates due to dilution of KCl or presence of reducing reagentB) alkaline fault - electrode responds to Na+ instead of H+ when [Na+] is low and [H+] is highC) acid error – the measured pH is higher than the actual pH because the glass is saturated with H+ and can no longer be protonatedD) temperature – the pH meter is calibrated at different temperatures from the samplearrow_forward
- When measured with a F ion-selective electrode with a Nernstian response at 25 °C, the potential dueto F' in unfluorinated ground water in Foxboro, Massachusetts, was 40.0 mV more positive than thepotential of tap water in Providence, Rhode Island. Providence maintains its fluorinated water at therecommended level of 1.00 mg F* / L. What is the concentration of F in mg/L in ground water inarrow_forwardThe concentration of yeast RNA in an aqueous solution is 12.0 mg/L. The absorbance is found to be 0.208 when this solution is placed in a 1.00 cm cell at 265 nm. Its molecular weight is 5.7 x 10³ g/mol. a) Calculate the molar absorptivity of the yeast RNA. b) What will be the absorbance if the solution is 6.0 mg/L and the path length is 1.00 cm? c) What will be the absorbance if the solution is 12 mg/L and the path length is 2.00 cm? (Show your work)arrow_forward2) Name the advantages of glass electrode in potentiometric measurements (please write correctly and concisely).arrow_forward
 Principles of Instrumental AnalysisChemistryISBN:9781305577213Author:Douglas A. Skoog, F. James Holler, Stanley R. CrouchPublisher:Cengage Learning