Concept explainers
Videos
The function f graphed below is defined by a polynomial expression of degree 4. Use the graph to solve the exercises.
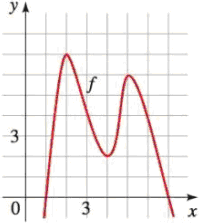
2. The domain of the function f is all the ___-values of the points on the graph, and the range is all the corresponding ___-values. From the graph of f we see that the domain of f is the interval _____ and the range of f is the interval _____.
Want to see the full answer?
Check out a sample textbook solution
Chapter 2 Solutions
Bundle: Precalculus: Mathematics for Calculus, 7th + WebAssign Printed Access Card for Stewart/Redlin/Watson's Precalculus, Enhanced Edition, 7th Edition, Single-Term
Additional Math Textbook Solutions
Glencoe Math Accelerated, Student Edition
Calculus and Its Applications (11th Edition)
University Calculus: Early Transcendentals (3rd Edition)
Calculus For The Life Sciences
Precalculus: Concepts Through Functions, A Unit Circle Approach to Trigonometry (4th Edition)


- The function f graphed below is defined by a polynomial expression of degree 4. Use the graph of solve the exercises. The domain of the function f is all the _____-values of the points on the graph, and the range is all the corresponding_____-values. From the graph of f we see that the domain of f is the interval ________ and the range of f is the interval ________.arrow_forwardThe function f graphed below is defines by a polynomial expression of degree 4. Use the graph to solve the exercises. (a) A function value f (a) is a local maximum value of f if f (a) is the____ value of f on some open interval containing a. From the graph of f we see that there are two local maximum values of f : One local Maximum is ______, and it occurs when x=2; The other local maximum is ______, and it occurs when x=_______. (b) The function value f (a) is a local minimum value of f if f (a) is the _____ value of f on some open interval containing a.From the graph of f we see that there is one local minimum value of f .The local minimum value is,______ and it occurs when x=______.arrow_forwardThe function f graphed below is defined by a polynomial equation of degree 4 .use the graph to solve the exercises. (a) if f is increasing on an interval then the y-values of the point on the graph _______ as the x-values increase. From the graph of f we see that f is increasing on the interval _______and ________. (b) If f is decreasing on an interval, then the y-values of the points on the graph_____ as the x-values increases. From the graph of f we see that f is decreasing on the interval_____ and______.arrow_forward
- The amount of garbage, G, produced by a city with population p is given by G=f(p) . G is measured in tons per week, and p is measured in thousands of people. a.The town of Tola has a population of 40,000 and produces 13 tons of garbage each week. Express this information in terms of the function f. b.Explain the meaning of the statement f(5)=2 .arrow_forwardThe graph of a polynomial function can have infinitely many vertical asymptotes. (true/false, justify your answer)arrow_forward
 College AlgebraAlgebraISBN:9781305115545Author:James Stewart, Lothar Redlin, Saleem WatsonPublisher:Cengage Learning
 Algebra & Trigonometry with Analytic GeometryAlgebraISBN:9781133382119Author:SwokowskiPublisher:Cengage
 Algebra and Trigonometry (MindTap Course List)AlgebraISBN:9781305071742Author:James Stewart, Lothar Redlin, Saleem WatsonPublisher:Cengage Learning

 Glencoe Algebra 1, Student Edition, 9780079039897...AlgebraISBN:9780079039897Author:CarterPublisher:McGraw Hill