
Sub part (a):
The Gini ratio.
Sub part (a):
Explanation of Solution
Figure 1 illustrates the Lorenz curve.
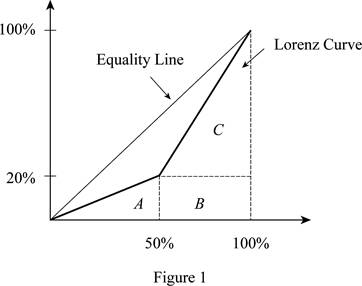
In Figure 1, the horizontal axis measures the percentage of population and the vertical axis measures the percentage of income. In this, we find the area under the Lorenz curve. Thus, the area of triangle can be calculated as follows:
Thus, the area of triangle is 500.
The base of the triangle is 50 (at 50%) because there are only two people in the economy. The height of the triangle is 20 (at 20%) because the lowest income is $20,000, which is 20% of the total income earned in society (= ($20,000 / $100,000) x 100).
The area of the rectangle of B can be calculated as follows:
Thus, the area of the rectangle B value is 1,000.
The area of the rectangle of C can be calculated as follows:
The area of triangle C is 2,000.
The total area under the Lorenz curve can be calculated as follows:
The total area value is 3,500.
The Gini ratio can be calculated as follows:
Thus, the Gini ratio is 0.300.
Concept introduction:
Gini ratio: It is a measure of statistical scattering that is intended to represent the income distribution of a nation's residents and is most commonly used to measure inequality.
Lorenz curve: It is the graphical illustration of the income distribution or of the wealth.
Sub Part (b):
The Gini ratio in the scenario 2.
Sub Part (b):
Explanation of Solution
After the tax and redistribution program Larry's new income is $40,000 and Roger's new income is $60,000. This implies that Larry (50% of the population) now controls 40% of the society's income rather than the 20% before the program.
The area of the triangle A can be calculated as follows:
The value of the triangle area is 1,000.
The value of rectangle B can be calculated as follows:
The area of rectangle B is 2,000.
The area of rectangle C can be calculated as follows:
The area of triangle C can be calculated as follows:
The total area under the Lorenz curve can be calculated as follows:
The total area value is 4,500.
The Gini ratio can be calculated as follows:
Thus the Gini ratio here is 0.100.
Concept introduction:
Gini ratio: It is a measure of statistical scattering that is intended to represent the income distribution of a nation's residents and is most commonly used to measure inequality.
Lorenz curve: It is the graphical illustration of the income distribution or of the wealth.
Sub part (c):
Change in the Gini ratio with change in income.
Sub part (c):
Explanation of Solution
If the income is double, Larry will earn $40,000 and Roger will earn $160,000. The total income in society is now $200,000. Larry still only controls 20% of the society's income ((=$40,000/$200,000) x 100).
Since the doubling of income does not change the percentage of income that is controlled by Larry (or Roger) , the Gini ratio will not change. Thus, the answer will be the same as in part 'a' at 0.300. Thus, the Gini ratio remains the same as it was before and after the income doubles.
Want to see more full solutions like this?
Chapter 23 Solutions
MICROECONOMICS (LL)-W/CONNECT ACCESS

- (Last Word) The combined cost of Social Security and Medicare programs was what percent of U.S. GDP in 2008 (A) 7.6 (B) 12.4 (C) 17.2 (D) 2.9arrow_forwardIf there are two communities, one with ten families have incomes of $100,000 each and ten families have incomes of $20,000 each. In the other community, ten families have incomes of $250,000 each and ten families have incomes of $25,000 each. Which community is the distribution of income more unequal? In which community is the problem of poverty likely to be worse?Which distribution of income would Rawls prefer? Explain.Which distribution of income do you prefer? Explain.Why might someone have the opposite preference?arrow_forwardImagine an economy with only two people. Larry earns $20,000 per year, while Roger earns $80,000 per year. As shown in the following figure, the Lorenz curve for this twoperson economy consists of two line segments. The first runs from the origin to point a, while the second runs from point a to point b. a. Calculate the Gini ratio for this two-person economy using the geometric formulas for the area of a triangle (= ½ × base × height) and the area of a rectangle ( = base × height). (Hint: The area under the line segment from point a to point b can be thought of as the sum of the area of a particular triangle and the area of a particular rectangle.) b. What would the Gini ratio be if the government taxed $20,000 away from Roger and gave it to Larry? (Hint: The figure will change.) c. Start again with Larry earning $20,000 per year and Roger earning $80,000 per year. What would the Gini ratio be if both their incomes doubled? How much has the Gini ratio changed from before the doubling…arrow_forward
- Give some examples of how Lorenz curves and Gini coefficients can be used as summary measures of equality and inequality in a nation's distribution of income.arrow_forwardWorld Bank data show that in 1995, the poorest 20% of households accounted for 7.5% of household income in Niger, the next 20% of households accounted for 11.8% of income, the middle 20% accounted for 15.5% of income, the second richest 20% accounted for 21.1% of income, and the top 20% accounted for 44.1% of income. What was the cumulative income share of the bottom 60% of households in Niger? 2. Draw a Lorenz curve and calculate the Gini coefficient for Niger.arrow_forwardIf the tax code exempts the first $20,000 of income from taxation and then taxes 25 percent of all income above that level, then a person who earns percent and a marginal tax rate of $50,000 has an average tax rate of percent. O 15, 25 O 25, 15 O 25, 30 O 30, 25arrow_forward
- Assume that workers whoses are less than $8000 currently pay no federal income taxes. Suppose a new government program guarantees each worker $4000, whether or not he or she earns any income. For all earned income up to $8000, the worker must pay a 50- percent tax. Draw the budget line facing the worker under this new program. Using the line drawing tool, draw the new budget line facing a worker whose wage is such that his or her pre-tax earned income is less than $8000. Label this line 'BC2'.arrow_forward20.7 Essay: How Economic Inequality Arises 1) What is "human capital" and why is it considered an investment? 2) What is "human capital"? How is it important in the determination of a worker's wage rate? 3) How is human capital acquired? 4) How does the demand for high-skilled workers compare to the demand for low-skilled workers? Why does this difference exist? 5) How does an increase in the cost to acquire a skill affect the vertical distance between the supply curves of high-skilled and low-skilled workers?arrow_forwardJana has the opportunity to buy the boat of her dreams but needs to determine the best way to fund the purchase. The cost of the boat is $22,000, and she’s considering taking on a second job at which she can earn this amount or selling some investments to generate the cash. However, she realizes that she will also have to pay taxes on any amount she receives. If Jana is in the 35 percent marginal tax bracket and earns $22,000 from a second job, by how much will her end-of-year tax liability increase? What if she elects to sell some investments that she’s held for several years at a gain of $22,000? How would your answer change if she had held the investments for just 6 months?arrow_forward

 Principles of Economics (12th Edition)EconomicsISBN:9780134078779Author:Karl E. Case, Ray C. Fair, Sharon E. OsterPublisher:PEARSON
 Engineering Economy (17th Edition)EconomicsISBN:9780134870069Author:William G. Sullivan, Elin M. Wicks, C. Patrick KoellingPublisher:PEARSON
 Principles of Economics (MindTap Course List)EconomicsISBN:9781305585126Author:N. Gregory MankiwPublisher:Cengage Learning
 Managerial Economics: A Problem Solving ApproachEconomicsISBN:9781337106665Author:Luke M. Froeb, Brian T. McCann, Michael R. Ward, Mike ShorPublisher:Cengage Learning
 Managerial Economics & Business Strategy (Mcgraw-...EconomicsISBN:9781259290619Author:Michael Baye, Jeff PrincePublisher:McGraw-Hill Education