
Intro STATS, Books a la Carte Plus New Mystatlab with Pearson Etext -- Access Card Package
4th Edition
ISBN: 9780321869852
Author: Richard D. De Veaux
Publisher: PEARSON
expand_more
expand_more
format_list_bulleted
Concept explainers
Videos
Textbook Question
Chapter 23, Problem 35E
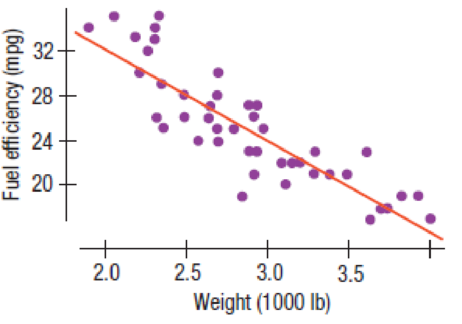
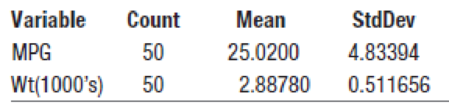
Fuel economy A consumer organization has reported test data for 50 car models. We will examine the association between the weight of the car (in thousands of pounds) and the fuel efficiency (in miles per gallon). Here are the
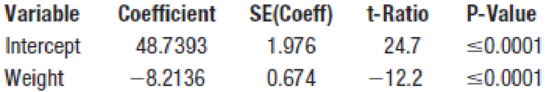
Dependent variable is MPG
R-squared = 75.6%
s = 2.413 with 50 – 2 = 48 df
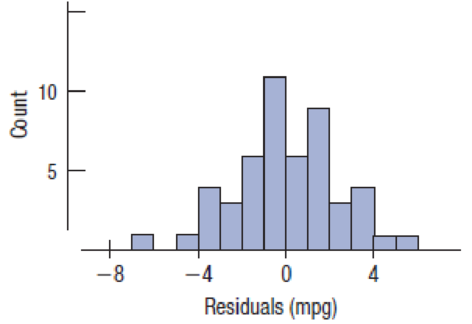
- a) Is there strong evidence of an association between the weight of a car and its gas mileage? Write an appropriate hypothesis.
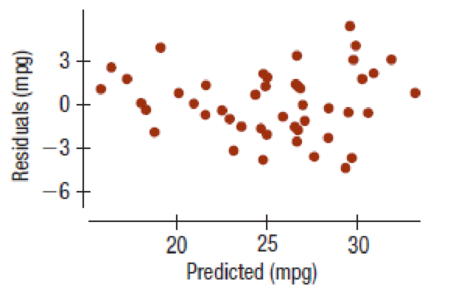
- b) Are the assumptions for regression satisfied?
- c) Test your hypothesis and state your conclusion.
Expert Solution & Answer

Trending nowThis is a popular solution!

Chapter 23 Solutions
Intro STATS, Books a la Carte Plus New Mystatlab with Pearson Etext -- Access Card Package
Ch. 23.4 - Researchers in Food Science studied how big...Ch. 23.4 - Prob. 2JCCh. 23.4 - Prob. 3JCCh. 23 - Prob. 1ECh. 23 - Prob. 2ECh. 23 - Prob. 3ECh. 23 - Prob. 4ECh. 23 - Prob. 5ECh. 23 - Prob. 6ECh. 23 - Prob. 7E
Ch. 23 - Prob. 8ECh. 23 - Prob. 9ECh. 23 - Prob. 10ECh. 23 - Prob. 11ECh. 23 - 12. Shoot to score, double overtime One of the...Ch. 23 - Prob. 13ECh. 23 - Prob. 14ECh. 23 - Prob. 15ECh. 23 - Prob. 16ECh. 23 - Prob. 17ECh. 23 - Prob. 18ECh. 23 - Prob. 19ECh. 23 - Prob. 20ECh. 23 - Prob. 21ECh. 23 - Prob. 22ECh. 23 - Prob. 23ECh. 23 - Prob. 24ECh. 23 - Prob. 25ECh. 23 - Prob. 26ECh. 23 - Prob. 27ECh. 23 - Prob. 28ECh. 23 - Prob. 29ECh. 23 - Prob. 30ECh. 23 - Prob. 31ECh. 23 - Prob. 32ECh. 23 - Prob. 33ECh. 23 - Prob. 34ECh. 23 - Fuel economy A consumer organization has reported...Ch. 23 - 36. SAT scores How strong was the association...Ch. 23 - Prob. 37ECh. 23 - 38. SATs, part II Consider the high school SAT...Ch. 23 - 39. Fuel economy, part III Consider again the data...Ch. 23 - 40. SATs, again Consider the high school SAT...Ch. 23 - Cereals A healthy cereal should be low in both...Ch. 23 - Brain size Does your IQ depend on the size of your...Ch. 23 - Prob. 43ECh. 23 - Prob. 44ECh. 23 - Prob. 45ECh. 23 - Prob. 46ECh. 23 - Ozone and population The Environmental Protection...Ch. 23 - Prob. 48ECh. 23 - Prob. 49ECh. 23 - 50. More sales and profits Consider again the...Ch. 23 - Prob. 51ECh. 23 - Crawling Researchers at the University of Denver...Ch. 23 - 53. Body fat Do the data shown in the table below...Ch. 23 - Prob. 54ECh. 23 - Midterms The data set below shows midterm and...Ch. 23 - Prob. 56ECh. 23 - Prob. 57ECh. 23 - All the efficiency money can buy 2011 A sample of...Ch. 23 - Education and mortality The following software...Ch. 23 - Property assessments The following software output...Ch. 23 - Prob. 61ECh. 23 - Prob. 62E
Knowledge Booster


Learn more about
Need a deep-dive on the concept behind this application? Look no further. Learn more about this topic, statistics and related others by exploring similar questions and additional content below.Similar questions
- Noise and Intelligibility Audiologists study the intelligibility of spoken sentences under different noise levels. Intelligibility, the MRT score, is measured as the percent of a spoken sentence that the listener can decipher at a cesl4ain noise level in decibels (dB). The table shows the results of one such test. (a) Make a scatter plot of the data. (b) Find and graph the regression line. (c) Find the correlation coefficient. Is a linear model appropriate? (d) Use the linear model in put (b) to estimate the intelligibility of a sentence at a 94-dB noise level.arrow_forwardXYZ Corporation Stock Prices The following table shows the average stock price, in dollars, of XYZ Corporation in the given month. Month Stock price January 2011 43.71 February 2011 44.22 March 2011 44.44 April 2011 45.17 May 2011 45.97 a. Find the equation of the regression line. Round the regression coefficients to three decimal places. b. Plot the data points and the regression line. c. Explain in practical terms the meaning of the slope of the regression line. d. Based on the trend of the regression line, what do you predict the stock price to be in January 2012? January 2013?arrow_forward
Recommended textbooks for you
 Glencoe Algebra 1, Student Edition, 9780079039897...AlgebraISBN:9780079039897Author:CarterPublisher:McGraw Hill
 Functions and Change: A Modeling Approach to Coll...AlgebraISBN:9781337111348Author:Bruce Crauder, Benny Evans, Alan NoellPublisher:Cengage Learning
 Algebra and Trigonometry (MindTap Course List)AlgebraISBN:9781305071742Author:James Stewart, Lothar Redlin, Saleem WatsonPublisher:Cengage Learning
 Big Ideas Math A Bridge To Success Algebra 1: Stu...AlgebraISBN:9781680331141Author:HOUGHTON MIFFLIN HARCOURTPublisher:Houghton Mifflin Harcourt
 College AlgebraAlgebraISBN:9781305115545Author:James Stewart, Lothar Redlin, Saleem WatsonPublisher:Cengage Learning
Glencoe Algebra 1, Student Edition, 9780079039897...
Algebra
ISBN:9780079039897
Author:Carter
Publisher:McGraw Hill
Functions and Change: A Modeling Approach to Coll...
Algebra
ISBN:9781337111348
Author:Bruce Crauder, Benny Evans, Alan Noell
Publisher:Cengage Learning
Algebra and Trigonometry (MindTap Course List)
Algebra
ISBN:9781305071742
Author:James Stewart, Lothar Redlin, Saleem Watson
Publisher:Cengage Learning
Big Ideas Math A Bridge To Success Algebra 1: Stu...
Algebra
ISBN:9781680331141
Author:HOUGHTON MIFFLIN HARCOURT
Publisher:Houghton Mifflin Harcourt
College Algebra
Algebra
ISBN:9781305115545
Author:James Stewart, Lothar Redlin, Saleem Watson
Publisher:Cengage Learning
Correlation Vs Regression: Difference Between them with definition & Comparison Chart; Author: Key Differences;https://www.youtube.com/watch?v=Ou2QGSJVd0U;License: Standard YouTube License, CC-BY
Correlation and Regression: Concepts with Illustrative examples; Author: LEARN & APPLY : Lean and Six Sigma;https://www.youtube.com/watch?v=xTpHD5WLuoA;License: Standard YouTube License, CC-BY