
To determine: The number of workers employed in each region during the given period of time.
Concept Introduction
Labor Force: Labor force refers to the total number of workers in an economy which includes employed as well as unemployed workers.
Explanation of Solution
a. Number of employed workers in April 2013 and April 2014.
The formula to calculate the number of employed workers is as follows:
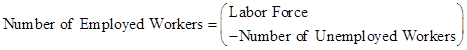
The below table shows the calculation of employed workers:
April 2013
| Region | Labor Force(Thousands)(A) | Unemployed Workers(Thousands)(B) | Employed Workers(Thousands) |
| Northeast | 28,407.2 | 2,174.4 | 26,232.8 |
| South | 56,787.8 | 4,089.9 | 52,697.9 |
| Midwest | 34,320.0 | 2,473.7 | 31,846.3 |
| West | 36,122.2 | 2,940.8 | 33,181.4 |
| Total | 143,958.4 |
April 2014
| Region | Labor Force(Thousands)(A) | Unemployed Workers(Thousands)(B) | Employed Workers(Thousands) |
| Northeast | 28,288.9 | 1,781.3 | 26,507.6 |
| South | 57,016.4 | 3,363.8 | 53,652.6 |
| Midwest | 34,467.0 | 2,109.0 | 32,358.0 |
| West | 36,307.3 | 2,535.7 | 33,771.6 |
| Total | 146,289.8 |
The change in the number of employed workers between April 2013 and April 2014 shall be calculated as follows:
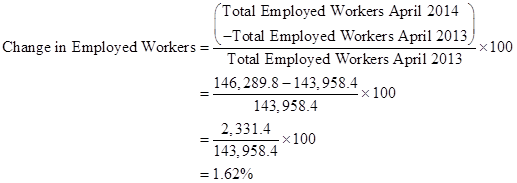
Conclusion:
Thus, there is an increase in number of employed workers between April 2013 and April 2014.
b. Growth in labor force.
The formula to calculate the growth in labor force between April 2013 and April 2014 is as follows:

The below table shows the calculation of growth in labor force in each region:
| Region | Labor Force in April 2013(Thousands)(A) | Labor Force in April 2014(Thousands)(B) | Growth in Labor Force(%)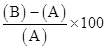 |
| Northeast | 28,407.2 | 28,288.9 |  |
| South | 56,787.8 | 57,016.4 | 0.41 |
| Midwest | 34,320.0 | 34,467.0 | 0.43 |
| West | 36,122.2 | 36,307.3 | 0.51 |
Conclusion:
Thus, there is a decrease in labor force in the Northeast and a growth in other regions.
c.
The formula to calculate the unemployment rate is as follows:
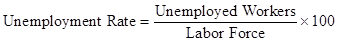
The below table shows the calculation of unemployment rate in each region:
April 2013
| Region | Labor Force(Thousands)(A) | Unemployed Workers(Thousands)(B) | Unemployment Rate(%) |
| Northeast | 28,407.2 | 2,174.4 | 7.65 |
| South | 56,787.8 | 4,089.9 | 7.20 |
| Midwest | 34,320.0 | 2,473.7 | 7.21 |
| West | 36,122.2 | 2,940.8 | 8.14 |
April 2014
| Region | Labor Force(Thousands)(A) | Unemployed Workers(Thousands)(B) | Unemployment Rate(%) |
| Northeast | 28,288.9 | 1,781.3 | 6.3 |
| South | 57,016.4 | 3,363.8 | 5.9 |
| Midwest | 34,467.0 | 2,109.0 | 6.12 |
| West | 36,307.3 | 2,535.7 | 6.98 |
Conclusion:
Thus, there is a decrease in unemployment rate in all the regions between April 2013 and April 2014.
d. Reason for fall in unemployment rate.
The unemployment rate has decreased in all the regions between April 2013 and April 2014.
The decrease in unemployment rate is shown in the table below:
| Region | Unemployment RateApril 2013(A)(%) | Unemployment RateApril 2014(B)(%) | Fall in Unemployment Rate(%) |
| Northeast | 7.65 | 6.3 | 1.35 |
| South | 7.20 | 5.9 | 1.3 |
| Midwest | 7.21 | 6.12 | 1.09 |
| West | 8.14 | 6.98 | 1.16 |
- It can be seen that in the regions of South, Midwest and West, the labor force has increased from April 2013 to April 2014.
- Hence, in these regions, the fall in unemployment rate is due to considerable net gain in the number of jobs.
- However, there is decrease in labor force in Northeast and still there is fall in unemployment rate due to the fall in number of people seeking jobs.
Conclusion:
Thus, there is a fall in unemployment rate.
Want to see more full solutions like this?
Chapter 23 Solutions
LaunchPad for Krugman's Economics 4e (Twelve-Month Access)


 Principles of Economics (12th Edition)EconomicsISBN:9780134078779Author:Karl E. Case, Ray C. Fair, Sharon E. OsterPublisher:PEARSON
 Engineering Economy (17th Edition)EconomicsISBN:9780134870069Author:William G. Sullivan, Elin M. Wicks, C. Patrick KoellingPublisher:PEARSON
 Principles of Economics (MindTap Course List)EconomicsISBN:9781305585126Author:N. Gregory MankiwPublisher:Cengage Learning
 Managerial Economics: A Problem Solving ApproachEconomicsISBN:9781337106665Author:Luke M. Froeb, Brian T. McCann, Michael R. Ward, Mike ShorPublisher:Cengage Learning
 Managerial Economics & Business Strategy (Mcgraw-...EconomicsISBN:9781259290619Author:Michael Baye, Jeff PrincePublisher:McGraw-Hill Education