
Concept explainers
Videos
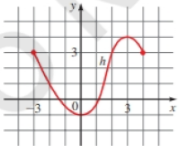
Values of a Function The graph of a function h is given.
(a) Find
(b) Find the domain and range of h.
(c) Find the values of x for which
(d) Find the values of x for which
(e) Find the net change in h between
Want to see the full answer?
Check out a sample textbook solution
Chapter 2 Solutions
College Algebra


- Average Rate of Change The graphs of the functions f and g are shown. The function _____ (f or g) has a greater average rate of change between x=0 and x=1 .The function (f or q) has a greater average rate of change between x=1 and x=2 .The functions f and q have the same average rate of change between x = ____ and x = __.arrow_forwardMagazine Circulation: The circulation C of a certain magazine as a function of time t is given by the formula C=5.20.1+0.3t Here C is measured in thousands, and t is measured in years since the beginning of 2006, when the magazine was started. a. Make a graph of C versus t covering the first 6 years of the magazines existence. b. Express using functional notation the circulation of the magazine 18 months after it was started, and then find that value. c. Over what time interval is the graph of C concave up? Explain your answer in practical terms. d. At what time was the circulation increasing the fastest?. e. Determine the limiting value for C. Explain your answer in practical terms.arrow_forwardConcentration of a Mixture A 1000-liter tank contains 50 liters of a 25brine solution. You add xliters of a 75brine solution to the tank. (a) Show that the concentration C, the proportion of brine to total solution, in the final mixture is C=3x+504(x+50). (b) Determine the domain of the function based on the physical constraints of the problem. (c) Sketch the graph of the concentration function. (d) As the tank is filled, what happens to the rate at which the concentration of brine is increasing? What percent does the concentration of brine appear to approach?arrow_forward
- Local Maximum and Minimum Values The graph of A function f is given the graph to estimate the following. (a) All the local maximum and minimum value of the function and the value of x at which each occurs. (b) The intervals on which the function is increasing and on which the function is decreasing.arrow_forwardChanging Water Levels: The graph shows the depth of water Win a reservoir over a one-year period as a function of the number of days xsince the beginning of the year. (a) Determine the intervals on which the function W is increasing and on which it is decreasing. (b) At what value of x does W achieve a local maximum? A local minimum? (c) Find the net change in the depth W from 100 days to 300 daysarrow_forwardRadius of a Shock Wave An explosion produces a spherical shock wave whose radius R expands rapidly. The rate of expansion depends on the energy E of the explosion and the elapsed time t since the explosion. For many explosions, the relation is approximated closely by R=4.16E0.2t0.4. Here R is the radius in centimeters, E is the energy in ergs, and t is the elapsed time in seconds. The relation is valid only for very brief periods of time, perhaps a second or so in duration. a. An explosion of 50 pounds of TNT produces an energy of about 1015 ergs. See Figure 2.71. How long is required for the shock wave to reach a point 40 meters 4000 centimeters away? b. A nuclear explosion releases much more energy than conventional explosions. A small nuclear device of yield 1 kiloton releases approximately 91020 ergs. How long would it take for the shock wave from such an explosion to reach a point 40 meters away? c. The shock wave from a certain explosion reaches a point 50 meters away in 1.2 seconds. How much energy was released by the explosion? The values of E in parts a and b may help you set an appropriate window. Note: In 1947, the government released film of the first nuclear explosion in 1945, but the yield of the explosion remained classified. Sir Geoffrey Taylor used the film to determine the rate of expansion of the shock wave and so was able to publish a scientific paper concluding correctly that the yield was in the 20-kiloton range.arrow_forward
- Reaction Rates In a chemical reaction, the reaction rate R is a function of the concentraton of the product of the reaction. For a certain second-order reaction between two substances, we have the formula R=0.01x2x+22. Here x is measured in moles per cubic meter and R is measured in moles per cubic meter per second. a. Make a graph of R versus x. Include concentrations up to 100 moles per cubic meter. b. Use functional notation to express the reaction rate when the concentration is 15 moles per cubic meter, and then calculate hat value. c. The reaction is said to be in equilibrium when the reaction rate is 0. At what two concentratoins is the reaction in equilibrium?arrow_forwardNet Change and Average Rate of Change A function is given either numerically, graphically, or algebraically). Find the net change and the average rate of change of the function between the indicated values. Between x=4 and x=8arrow_forwardLocal Maximum and Minimum ValuesThe graph of a function f is given. Use the graph to estimate the following. (a) All the local maximum and minimum values of the function and the value of x at which each occurs. (b) The intervals on which the function is increasing and on which the function is decreasing.arrow_forward
- Population Growth and Decline The graph shows the population P in a small industrial city from 1950 to 2000. Thevariable x represents the number of year since 1950. (a) Determine the intervals on which the function P isincreasing and on which it is decreasing. (b) What as the maximum population, and in what yearwas it attained? (c) Find the net change in the population P from 1970 to 1990.arrow_forwardPopulation Growth The growth G of a population of lower organisms over a day is a function of the population size n at the beginning of the day. If both n and G are measured in thousands of organisms, the formula is G=-0.03n2+n. a. Make a graph of G versus n. Include values of n up to 40 thousand onganisms. b. Calculate G35 and explain in practical terms what your answer means. c. For what two population levels will the population grow by 5 thousand over a day? d. If there is no population to start with, of course there will ne no growth. At what other population level will there be no growth?arrow_forwardFluid Flow The intake pipe of a 100-gallon tank has a flow rate of 10 gallons per minute, and two drainpipes have flow rates of 5 gallons per minute each. The figure shows the volume V of fluid in the tank as a function of time t. Determine whether the input pipe and each drainpipe are open or closed in specific subintervals of the 1 hour of time shown in the graph. (There are many correct answers.)arrow_forward
 College AlgebraAlgebraISBN:9781305115545Author:James Stewart, Lothar Redlin, Saleem WatsonPublisher:Cengage Learning
 Algebra and Trigonometry (MindTap Course List)AlgebraISBN:9781305071742Author:James Stewart, Lothar Redlin, Saleem WatsonPublisher:Cengage Learning
 Big Ideas Math A Bridge To Success Algebra 1: Stu...AlgebraISBN:9781680331141Author:HOUGHTON MIFFLIN HARCOURTPublisher:Houghton Mifflin Harcourt
 Functions and Change: A Modeling Approach to Coll...AlgebraISBN:9781337111348Author:Bruce Crauder, Benny Evans, Alan NoellPublisher:Cengage Learning
 Trigonometry (MindTap Course List)TrigonometryISBN:9781337278461Author:Ron LarsonPublisher:Cengage Learning