Concept explainers
Videos
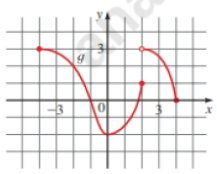
Values of a Function The graph of a function g is given.
(a) Find
(b) Find the domain and range of g.
(c) Find the values of x for which
(d) Estimate the a1ue of x for which
(e) Find the net change in g between
Want to see the full answer?
Check out a sample textbook solution
Chapter 2 Solutions
College Algebra


- Average Rate of Change The graphs of the functions f and g are shown. The function _____ (f or g) has a greater average rate of change between x=0 and x=1 .The function (f or q) has a greater average rate of change between x=1 and x=2 .The functions f and q have the same average rate of change between x = ____ and x = __.arrow_forwardLocal Maximum and Minimum Values The graph of A function f is given the graph to estimate the following. (a) All the local maximum and minimum value of the function and the value of x at which each occurs. (b) The intervals on which the function is increasing and on which the function is decreasing.arrow_forwardMagazine Circulation: The circulation C of a certain magazine as a function of time t is given by the formula C=5.20.1+0.3t Here C is measured in thousands, and t is measured in years since the beginning of 2006, when the magazine was started. a. Make a graph of C versus t covering the first 6 years of the magazines existence. b. Express using functional notation the circulation of the magazine 18 months after it was started, and then find that value. c. Over what time interval is the graph of C concave up? Explain your answer in practical terms. d. At what time was the circulation increasing the fastest?. e. Determine the limiting value for C. Explain your answer in practical terms.arrow_forward
- Concentration of a Mixture A 1000-liter tank contains 50 liters of a 25brine solution. You add xliters of a 75brine solution to the tank. (a) Show that the concentration C, the proportion of brine to total solution, in the final mixture is C=3x+504(x+50). (b) Determine the domain of the function based on the physical constraints of the problem. (c) Sketch the graph of the concentration function. (d) As the tank is filled, what happens to the rate at which the concentration of brine is increasing? What percent does the concentration of brine appear to approach?arrow_forwardDetermine whether the function is increasing ordecreasing. g(x)=x+2arrow_forwardLinear Functions A linear functions is described either verbally, numerically, or graphically. Express f in the form f(x)=ax+b . The graph of the function has slope 12 and y-intercept -1.arrow_forward
- The function f graphed below is defined by a polynomial equation of degree 4 .use the graph to solve the exercises. (a) if f is increasing on an interval then the y-values of the point on the graph _______ as the x-values increase. From the graph of f we see that f is increasing on the interval _______and ________. (b) If f is decreasing on an interval, then the y-values of the points on the graph_____ as the x-values increases. From the graph of f we see that f is decreasing on the interval_____ and______.arrow_forwardLocal Maximum and Minimum ValuesThe graph of a function f is given. Use the graph to estimate the following. (a) All the local maximum and minimum values of the function and the value of x at which each occurs. (b) The intervals on which the function is increasing and on which the function is decreasing.arrow_forwardMinimizing a Distance When we seek a minimum or maximum value of a function, it is sometimes easier to work with a simpler function instead. Suppose g(x)=f(x) where f(x)0 for all x. Explain why the local minima and maxima of f and g occur at the same values of x. Let gx be the distance between the point 3,0 and the point (x,x2) on the graph of the parabola y=x2. Express g as a function of x. Find the minimum value of the function g that you found in part b. Use the principle described in part a to simplify your work.arrow_forward
- Revenue A manufacturer finds that the revenue generated by selling x units of a certain commodity is given by the function R(x)=80x0.4x2, where the revenue R(x) is measured in dollars. What is the maximum revenue? and how many units should be manufactured to obtain this maximum?arrow_forwardVolume of a Box An open box is to constructed from a piece of cardboard 20 cm by 40 cm by cutting squares of side length x from each corner and folding up the sides, as shownin figure. (a) Express the volume V of the box as a function of x. (b) What is the domain of V? (Use the fact that length and volume must be positive.) (c) Draw a graph of the function V, and use it to estimate the maximum volume for such a box.arrow_forwardVolume of a box A cardboard box has a square base, with each edge of the base having length x inches, as shown in the figure. The total length of all 12 edges of the box is 144 in. (a) Show that the volume of the box is given by the function V(x)=2x2(18x). (b) What is the domain of V? Use the fact that length and volume must be positive. (c) Draw a graph of the function V and use it to estimate the maxim volume for such a box.arrow_forward
 Algebra and Trigonometry (MindTap Course List)AlgebraISBN:9781305071742Author:James Stewart, Lothar Redlin, Saleem WatsonPublisher:Cengage Learning
 College AlgebraAlgebraISBN:9781305115545Author:James Stewart, Lothar Redlin, Saleem WatsonPublisher:Cengage Learning
 Big Ideas Math A Bridge To Success Algebra 1: Stu...AlgebraISBN:9781680331141Author:HOUGHTON MIFFLIN HARCOURTPublisher:Houghton Mifflin Harcourt
 Trigonometry (MindTap Course List)TrigonometryISBN:9781337278461Author:Ron LarsonPublisher:Cengage Learning