
Applying the below data, but then an increase in fixed costs occurs. As a result the ATC curve below shifts upward. Consequently, the
Data
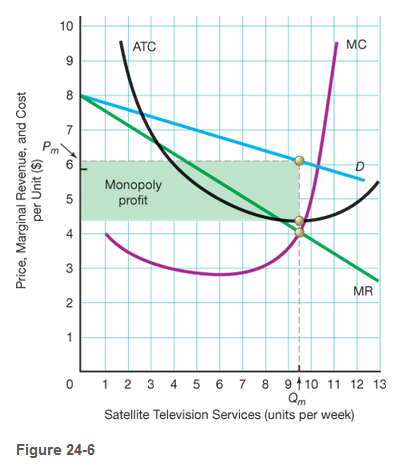
Suppose that Qm is 9.5 units per week, that Pm is $6.10 per unit, and that the average total cost of producing the 9.5 units is $4.26 per unit.
Concept introduction:
Revenue: Total amount received through product sales.
Profit: Profit is the difference between total revenue earned by selling the product and total cost incurred when producing the item.
Total revenue:
Total revenue is the revenue earned by selling all the products.
Total cost:
Total cost is the total cost incurred for producing the commodity.
Total Profit: Profit is the difference between total revenue earned by selling the product and total cost incurred in producing the item.
Want to see the full answer?
Check out a sample textbook solution
Chapter 24 Solutions
Economics Today: The Micro View, Student Value Edition Plus MyLab Economics with Pearson eText -- Access Card Package (19th Edition)


 Principles of Economics (12th Edition)EconomicsISBN:9780134078779Author:Karl E. Case, Ray C. Fair, Sharon E. OsterPublisher:PEARSON
 Engineering Economy (17th Edition)EconomicsISBN:9780134870069Author:William G. Sullivan, Elin M. Wicks, C. Patrick KoellingPublisher:PEARSON
 Principles of Economics (MindTap Course List)EconomicsISBN:9781305585126Author:N. Gregory MankiwPublisher:Cengage Learning
 Managerial Economics: A Problem Solving ApproachEconomicsISBN:9781337106665Author:Luke M. Froeb, Brian T. McCann, Michael R. Ward, Mike ShorPublisher:Cengage Learning
 Managerial Economics & Business Strategy (Mcgraw-...EconomicsISBN:9781259290619Author:Michael Baye, Jeff PrincePublisher:McGraw-Hill Education