
a.
To outline the design of the experiment.
a.
Explanation of Solution
Given:
The given values are-
Calculation:
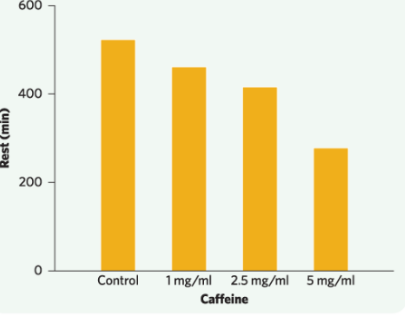
Randomly select four groups of fruit flies, then gave each group a different dosage of caffeine (control, 1 mg/ml, 2.5 mg/ml, and 5 mg/ml), then measure the rest time of each fruit fly during a 12-hour dark period.
b.
To find out which means does this test compare, and also state the null and alternative hypothesis for the test in the setting.
b.
Explanation of Solution
Given:
The following is the given graph-
Calculation:
The ANOVA F test compares the means of the four groups. Let be the mean rest time for the control group, be the mean rest time for group of a dosage of 1 mg/ml, be the mean rest time for group of a dosage of 2.5 mg/ml, and be the mean rest time for group of a dosage of 5 mg/ml. The hypotheses are:
H 0:
H a: not all
The graph shows that as the dosage of caffeine increases, the rest time decreases. The P-value of the ANOVA F test of P < 0.0001 leads a rejection of the null hypothesis. So at least one of the average rest times of the four groups is different.
Want to see more full solutions like this?
Chapter 24 Solutions
PRACT. OF STAT. IN LIFE SCI.W/ACHIEVE 1

 MATLAB: An Introduction with ApplicationsStatisticsISBN:9781119256830Author:Amos GilatPublisher:John Wiley & Sons Inc
 Probability and Statistics for Engineering and th...StatisticsISBN:9781305251809Author:Jay L. DevorePublisher:Cengage Learning
 Statistics for The Behavioral Sciences (MindTap C...StatisticsISBN:9781305504912Author:Frederick J Gravetter, Larry B. WallnauPublisher:Cengage Learning
 Elementary Statistics: Picturing the World (7th E...StatisticsISBN:9780134683416Author:Ron Larson, Betsy FarberPublisher:PEARSON
 The Basic Practice of StatisticsStatisticsISBN:9781319042578Author:David S. Moore, William I. Notz, Michael A. FlignerPublisher:W. H. Freeman
 Introduction to the Practice of StatisticsStatisticsISBN:9781319013387Author:David S. Moore, George P. McCabe, Bruce A. CraigPublisher:W. H. Freeman