
Concept explainers
Videos
Internet Use The following graph shows the percentage of U.S. residents who used the Internet at home in 2010 as a function of income (the data points) and a logistic model of these data (the curve).50
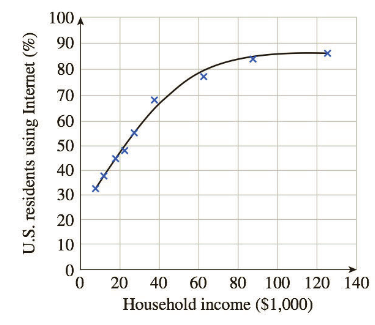
The logistic model is given by
a. According to the model, what percentage of extremely wealthy people used the Internet at home?
b. For low incomes the logistic model is approximately exponential. Which exponential model best approximates
c. According to the model, 50% of individuals with what household income used the Internet at home in 2010? (Round the answer to the nearest $1,000.)

Trending nowThis is a popular solution!

Chapter 2 Solutions
Applied Calculus


- What situations are best modeled by a logistic equation? Give an example, and state a case for why the example is a good fit.arrow_forwardEnter the data from Table 2 into a graphing calculator and graph the ranking scatter plot. Determine whetherthe data from the table would likely represent a function that is linear, exponential, or logarithmic.arrow_forwardWhat does the y -intercept on the graph of a logistic equation correspond to for a population modeled by that equation?arrow_forward
- Sales of a video game released in the year 2000 took off at first, but then steadily slowed as time moved on. Table 4 shows the number of games sold, in thousands, from the years 20002010. a. Let x represent time in years starting with x=1 for the year 2000. Let y represent the number of games sold in thousands. Use logarithmic regression to fit a model to these data. b. If games continue to sell at this rate, how many games will sell in 2015? Round to the nearest thousand.arrow_forwardWhat type (s) of translation(s), if any, affect the range of a logarithmic function?arrow_forwardDoes a linear, exponential, or logarithmic model best fit the data in Table 2? Find the model.arrow_forward
- World Population The following table shows world population N, in billions, in the given year. Year 1950 1960 1970 1980 1990 2000 2010 N 2.56 3.04 3.71 4.45 5.29 6.09 6.85 a. Use regression to find a logistic model for world population. b. What r value do these data yield for humans on planet Earth? c. According to the logistic model using these data, what is the carrying capacity of planet Earth for humans? d. According to this model, when will world population reach 90 of carrying capacity? Round to the nearest year. Note: This represents a rather naive analysis of world population.arrow_forwardWhat type (s) of translation (s), if any, affect thedomain ofa logarithmic function?arrow_forwardWhat might a scatterplot of data points look like if it were best described by a logarithmic model?arrow_forward
 Functions and Change: A Modeling Approach to Coll...AlgebraISBN:9781337111348Author:Bruce Crauder, Benny Evans, Alan NoellPublisher:Cengage Learning
 Algebra & Trigonometry with Analytic GeometryAlgebraISBN:9781133382119Author:SwokowskiPublisher:Cengage
 College AlgebraAlgebraISBN:9781305115545Author:James Stewart, Lothar Redlin, Saleem WatsonPublisher:Cengage Learning
 Calculus For The Life SciencesCalculusISBN:9780321964038Author:GREENWELL, Raymond N., RITCHEY, Nathan P., Lial, Margaret L.Publisher:Pearson Addison Wesley,
 Glencoe Algebra 1, Student Edition, 9780079039897...AlgebraISBN:9780079039897Author:CarterPublisher:McGraw Hill