
ELEMENTARY STATISTICS(LL)(FD)
3rd Edition
ISBN: 9781260707458
Author: Navidi
Publisher: MCGRAW-HILL CUSTOM PUBLISHING
expand_more
expand_more
format_list_bulleted
Videos
Textbook Question
Chapter 2.4, Problem 8E
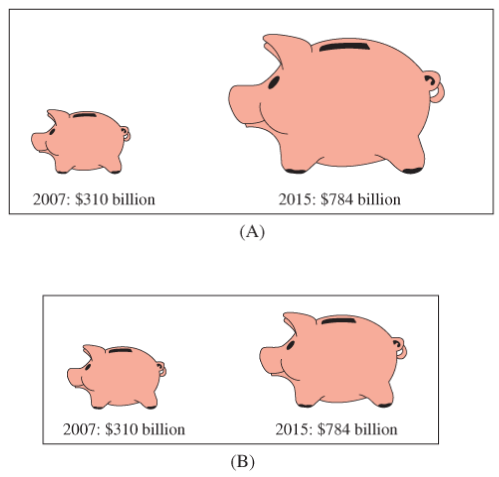
Save your money: In 2007, U.S. residents saved approximately $310 billion. In 2015, that amount was $784 billion, about two and-a-half times greater. Which of the following graphs compares these totals more accurately, and why? (Source: St. Louis Federal Reserve)
Expert Solution & Answer
Want to see the full answer?
Check out a sample textbook solution
Students have asked these similar questions
Please show steps in Excel.
The 32 teams in the National Football League (NFL) are worth, on average, $1.17 billion, 5% more than last year. The datafile NFLTEAMVALUE shows the annual revenue ($millions) and the estimated team value ($ millions) for the 32 NFL teams (Forbes website, February 28, 2014).
a.Develop a scatter diagram with Revenue on the horizontal axis and Value on the vertical axis. Does there appear that there is any relationship between the two variables?
b. What is the sample correlation coefficient? What can you say about the strength of the relationship between Revenue and Value?
Team
Revenue ($ millions)
Current Value ($ millions)
Arizona Cardinals
253
961
Atlanta Falcons
252
933
Baltimore Ravens
292
1,227
Buffalo Bills
256
870
Carolina Panthers
271
1,057
Chicago Bears
298
1,252
Cincinnati Bengals
250
924
Cleveland Browns
264
1,005
Dallas Cowboys
539
2,300
Denver Broncos
283
1,161
Detroit Lions
248
900
Green Bay Packers
282
1,183
Houston…
During a recent year, charitable contributions in the United States totaled $368 billion. The graph below shows to whom this money was donated. Determine how much money was donated to
educational organizations. (Round your answer to one decimal place.)
billion dollars
Health
8%
Education
15%
Religion
32%
Other
45%
Recipients of Charitable Contributions in the
United States
The bar graph shows Sebu's monthly expenses, bringing home $2,500/month and saving the rest. What percentage does each category in her budget overall? Show your work, rounding percentage's to the nearest tenth.
Budgeted Items
Chapter 2 Solutions
ELEMENTARY STATISTICS(LL)(FD)
Ch. 2.1 - In Exercises 5-8, fill in each blank with the...Ch. 2.1 - In Exercises 5-8, fill in each blank with the...Ch. 2.1 - In Exercises 5-8, fill in each blank with the...Ch. 2.1 - In Exercises 5-8, fill in each blank with the...Ch. 2.1 - In Exercises 9—12, determine whether the...Ch. 2.1 - In Exercises 9—12, determine whether the...Ch. 2.1 - In Exercises 9—12, determine whether the...Ch. 2.1 - In Exercises 9—12, determine whether the...Ch. 2.1 - The following bar graph presents the average...Ch. 2.1 - The most common blood typing system divides human...
Ch. 2.1 - Following is a pie chart that presents the...Ch. 2.1 - Government spending: The following pie chart...Ch. 2.1 - U.S. population: The following side-by-side bar...Ch. 2.1 - Super Bowl: The following side-by-side bar graph...Ch. 2.1 - Smartphone sales: The following frequency...Ch. 2.1 - Popular video games: The following frequency...Ch. 2.1 - More smartphones: Using the data in Exercise 19:...Ch. 2.1 - More video games: Using the data in Exercise 20:...Ch. 2.1 - Hospital admissions: The following frequency...Ch. 2.1 - World population: Following are the populations of...Ch. 2.1 - Ages of video garners: The Nielsen Company...Ch. 2.1 - How secure is your job? In a survey, employed...Ch. 2.1 - Back up your data: In a survey commissioned by the...Ch. 2.1 - Education levels: The following frequency...Ch. 2.1 - Twitter followers: The following frequency...Ch. 2.1 - Music sales: The following frequency distribution...Ch. 2.1 - Keeping up with the Kardashians: The following...Ch. 2.1 - Bought a new car lately? The following table...Ch. 2.1 - Bought a new- truck lately? The following table...Ch. 2.1 - Happy Halloween: The following table presents...Ch. 2.1 - Native languages: The following frequency...Ch. 2.1 - Proportion of females: Following are the...Ch. 2.2 - Prob. 5ECh. 2.2 - In Exercises 5—8, fill in each blank with the...Ch. 2.2 - In Exercises 5—8, fill in each blank with the...Ch. 2.2 - In Exercises 5—8, fill in each blank with the...Ch. 2.2 - In Exercises 9—12, determine whether the...Ch. 2.2 - In Exercises 9—12, determine whether the...Ch. 2.2 - In Exercises 9—12, determine whether the...Ch. 2.2 - In Exercises 9—12, determine whether the...Ch. 2.2 - In Exercises 13—16, classify the histogram as...Ch. 2.2 - In Exercises 13—16, classify the histogram as...Ch. 2.2 - In Exercises 13—16, classify the histogram as...Ch. 2.2 - In Exercises 13—16, classify the histogram as...Ch. 2.2 - In Exercises 17 and 18, classify the histogram as...Ch. 2.2 - In Exercises 17 and 18, classify the histogram as...Ch. 2.2 - Student heights: The following frequency histogram...Ch. 2.2 - Trained rats: Forty rats were trained to run a...Ch. 2.2 - Cholesterol: The following histogram shows the...Ch. 2.2 - Blood pressure: The following histogram shows the...Ch. 2.2 - Olympic athletes: The following frequency...Ch. 2.2 - Hows the weather? The following relative frequency...Ch. 2.2 - Skewed which way? For which of the following data...Ch. 2.2 - Skewed which way? For which of the following data...Ch. 2.2 - Batting average: The following frequency...Ch. 2.2 - Batting average: The following frequency...Ch. 2.2 - Time spent playing video games: A sample of 200...Ch. 2.2 - Murder, she wrote: The following frequency...Ch. 2.2 - BMW prices: The following table presents the...Ch. 2.2 - Geysers: The geyser Old Faithful in Yellowstone...Ch. 2.2 - Hail to the chief: There have been 58 presidential...Ch. 2.2 - Internet radio: The following table presents the...Ch. 2.2 - Brothers and sisters: Thirty students in a...Ch. 2.2 - Cough, cough: The following table presents the...Ch. 2.2 - Prob. 37ECh. 2.2 - Prob. 38ECh. 2.2 - Prob. 39ECh. 2.2 - Prob. 40ECh. 2.2 - Frequency polygon: Using the data in Exercise 29:...Ch. 2.2 - Prob. 42ECh. 2.2 - Ogive: Using the data in Exercise 27: Compute the...Ch. 2.2 - Ogive: Using the data in Exercise 28: Compute the...Ch. 2.2 - Ogive: Using the data in Exercise 29: Compute the...Ch. 2.2 - Prob. 46ECh. 2.2 - Prob. 47ECh. 2.2 - Prob. 48ECh. 2.2 - Prob. 49ECh. 2.2 - Prob. 50ECh. 2.2 - Prob. 51ECh. 2.2 - Prob. 52ECh. 2.2 - Frequencies and relative frequencies: The...Ch. 2.3 - In Exercises 3—6, fill in each blank with the...Ch. 2.3 - In Exercises 3—6, fill in each blank with the...Ch. 2.3 - In Exercises 3—6, fill in each blank with the...Ch. 2.3 - In Exercises 3—6, fill in each blank with the...Ch. 2.3 - Prob. 7ECh. 2.3 - In Exercises 7—10, determine whether the...Ch. 2.3 - In Exercises 7—10, determine whether the...Ch. 2.3 - In Exercises 7—10, determine whether the...Ch. 2.3 - Construct a stem-and-leaf plot for the following...Ch. 2.3 - Construct a stem-and-leaf plot for the following...Ch. 2.3 - List the data in the following stem-and-leaf plot....Ch. 2.3 - List the data in the following stein-and-leaf...Ch. 2.3 - Construct a dotplot for the data in Exercise 11.Ch. 2.3 - Prob. 16ECh. 2.3 - BMW prices: The following table presents the...Ch. 2.3 - Hows the weather? The following table presents the...Ch. 2.3 - Air pollution: The following table presents...Ch. 2.3 - Technology salaries: The following table presents...Ch. 2.3 - Tennis and golf: Following are the ages of the...Ch. 2.3 - Pass the popcorn: Following are the running times...Ch. 2.3 - More weather: Construct a dotplot for the data in...Ch. 2.3 - Prob. 24ECh. 2.3 - Looking for a job: The following table presents...Ch. 2.3 - Prob. 26ECh. 2.3 - Military spending: The following table presents...Ch. 2.3 - Prob. 28ECh. 2.3 - Dining out: The following time-series plot...Ch. 2.3 - Prob. 30ECh. 2.3 - Prob. 31ECh. 2.3 - More gold: The following time series plot presents...Ch. 2.3 - Prob. 33ECh. 2.3 - Prob. 34ECh. 2.3 - Vote: The following time-series plot presents the...Ch. 2.3 - Arctic ice sheet: The following table presents the...Ch. 2.3 - Prob. 37ECh. 2.4 - In Exercises 3 and 4, fill in each blank with the...Ch. 2.4 - In Exercises 3 and 4, fill in each blank with the...Ch. 2.4 - CD sales decline: Sales of CDs have been declining...Ch. 2.4 - Music sales: The following time-series plot and...Ch. 2.4 - Stock market prices: The Dow Jones Industrial...Ch. 2.4 - Save your money: In 2007, U.S. residents saved...Ch. 2.4 - Ill take mine with mustard: The following bar...Ch. 2.4 - Stream or download? The following bar graph...Ch. 2.4 - Female senators: Of the 100 members of the United...Ch. 2.4 - Age at marriage: Data compiled by the U.S. Census...Ch. 2.4 - College degrees: Both of the following time-series...Ch. 2.4 - Food expenditures: Both of the following...Ch. 2.4 - Prob. 15ECh. 2 - Following is the list of letter grades for...Ch. 2 - Prob. 2CQCh. 2 - Construct a frequency bar graph for the data in...Ch. 2 - Prob. 4CQCh. 2 - Prob. 5CQCh. 2 - Prob. 6CQCh. 2 - Prob. 7CQCh. 2 - Prob. 8CQCh. 2 - Prob. 9CQCh. 2 - Prob. 10CQCh. 2 - Following are the prices (in dollars) for a sample...Ch. 2 - Prob. 12CQCh. 2 - Prob. 13CQCh. 2 - Prob. 14CQCh. 2 - Prob. 15CQCh. 2 - Trust your doctor: The General Social Survey...Ch. 2 - Internet browsers: The following relative...Ch. 2 - Prob. 3RECh. 2 - Prob. 4RECh. 2 - Prob. 5RECh. 2 - House freshmen: Newly elected members of the U.S....Ch. 2 - More freshmen: For the data in Exercise 6:...Ch. 2 - Royalty: Following are the ages at death for all...Ch. 2 - Prob. 9RECh. 2 - Prob. 10RECh. 2 - Prob. 11RECh. 2 - Prob. 12RECh. 2 - Prob. 13RECh. 2 - Prob. 14RECh. 2 - Prob. 15RECh. 2 - Explain why the frequency bar graph and the...Ch. 2 - Prob. 2WAICh. 2 - Prob. 3WAICh. 2 - Prob. 4WAICh. 2 - Prob. 5WAICh. 2 - In the chapter introduction, we presented gas...Ch. 2 - In the chapter introduction, we presented gas...Ch. 2 - In the chapter introduction, we presented gas...Ch. 2 - Prob. 4CSCh. 2 - In the chapter introduction, we presented gas...Ch. 2 - Prob. 6CSCh. 2 - In the chapter introduction, we presented gas...Ch. 2 - Prob. 8CSCh. 2 - In the chapter introduction, we presented gas...
Knowledge Booster


Learn more about
Need a deep-dive on the concept behind this application? Look no further. Learn more about this topic, statistics and related others by exploring similar questions and additional content below.Similar questions
- Stock Market During the week of June 22, 2009, the closing numbers of the Dow Jones Industrial Average each day were: What was the overall change for the week? Was it positive or negative?arrow_forwardABC is an online-to-offline platform that sells e-commerce products to offline customers through a network of agents. ABC gives a commission to agents for each sale made. ABC has 4 main product categories: electronics, fashion, supermarket, and others. Please refer to the exhibits for data sets pertaining to the questions below. Today is May 16th. What is the average growth in average sales per agent per month from March to May target? Answer: % Which one is the category with the highest and lowest average month-on-month sales growth from March to May target? Answer: Highest: Lowest: Today is May We have got the interim result of the sales figures in the first half of May. Typically, the first half of the month constitutes of 40% of sales. Using this assumption, will we reach our May target? What % over the target will we over/under-deliver? Answer: under/over-deliver by % of target Using that assumption, which category (or categories) will not reach the targeted sales…arrow_forwardThe director of a nonprofit ballet company in a medium-sized city in a certain country is planning its next fundraising campaign. In recent years, the program has found the percentages of donors and gift levels given in the accompanying table. Develop a spreadsheet model to calculate the total amount donated based on this information if the company contacts 900 potential donors to donate at the $100 level or below E Click the icon to view the percentages of donors and gift levels. C..... 3 Philanthropist $5,000 11 =B3*C3 4 Producer's Circle $1,000 25 =B4*C4 5 Director's Circle $500 49 =B5 C5 6 Principal $100 8% =B6*C6*$B$9 7 Soloist $50 14% =B7*C7*SB$9 8. 9 Solicitations 900 10 Total Donations =SUM(D2:D7) Enter the values in the model. (Type integers or decimals. Do not round.) B D Average Number of Gifts 1 Gift Level Amount Donations 2 Benefactor $10,000 3 Philanthropist $5,000 11 4 Producer's Circle $1,000 25 5 Director's Circle $500 49 6 Principal $100 8% ns? 7 Soloist $50 14% 8. 9…arrow_forward
- see imagearrow_forwardPlease help with (d)arrow_forwardHealth insurers are beginning to offer telemedicine services online that replace the common office visit. Kean healthcare provides a video service that allows subscribers to connect with a physician online and receive prescribed treatments. Kean healthcare claims that users of its LiveHealth Online service saved a significant amount of money on a typical visit. The data shown below ($), for a sample of 5 online doctor visits, are consistent with the savings per visit reported by Kean Healthcare. 92 105 56 76 96 Assuming the population is roughly symmetric construct a 90% confidence interval for the mean savings for a televisit to the doctor as opposed to an office visit.arrow_forward
- Economics The Dow Jones Industrial Average (DJIA) reports the average prices of stocks for 30 companies. Use the table to determine the total decrease in the DJIA 1987 Friday, Oct. 16 - 108.35 DJIA for the two days. Monday, Oct. 19 -507.99arrow_forwardPlease answer the following question and show work! Answer all parts. Thank youarrow_forward3. science fiction 12% Answer: Categories of Books Sold romance 47.4 % mystery 13 % Answer: sports 12% 21-B Book Street Books sells about 1290 books each month. The circle graph displays the most popular book categories, by percentage, each month. computer 15.6 % Step 1. Find the number of romance books sold each month. Round your answer to the nearest integer. Step 2. Find the number of science fiction books sold each month. Round your answer to the nearest integer.arrow_forward
- Please explain.arrow_forwardThe percentage of U.S. college freshmen claiming no religious affiliation has risen in recent decades. The bar graph shows the percentage of first-year college students claiming no religious affiliation for four selected years from 1980 through 2012. a. Estimate the average yearly increase in the percentage of first-year college females claiming no religious affiliation. Round the percentage to the nearest tenth. b. Estimate the percentage of first-year college females who will claim no religious affiliation in 2030. Percentage of First-year U.S. College Students Claiming No Religious Affiliation b. The percentage of first-year college females who will claim no religious affiliation in 2030 is approximately.%. (Round to the nearest tenth as needed.) Percentage 30 Males 9 $ $ 25- 20- 15- Females 9.7 10- a. The average yearly increase in the percentage of first-year college females claiming no religious affiliation is approximately % per year. (Round to the nearest tenth as needed.) 14.9…arrow_forwardAccording to Zillow.com, the median sale price for homes in January for South Carolina, California, and Virginia over the last three years is given in the table below (measured in $100,000). able South Carolina California Virginia 2018 183 534 98 2019 193 555 94 2020 216 569 85 In South Carolina, realtors take 5.4% of the sale price on average as part of their commission. The average realtor commission rates in California and Virginia are 4.9% and 5.3%, respectively. Use matrix multiplication to find the total earned by realtors from their commissionsarrow_forward
arrow_back_ios
SEE MORE QUESTIONS
arrow_forward_ios
Recommended textbooks for you
 Holt Mcdougal Larson Pre-algebra: Student Edition...AlgebraISBN:9780547587776Author:HOLT MCDOUGALPublisher:HOLT MCDOUGAL
 Elementary AlgebraAlgebraISBN:9780998625713Author:Lynn Marecek, MaryAnne Anthony-SmithPublisher:OpenStax - Rice University
 Big Ideas Math A Bridge To Success Algebra 1: Stu...AlgebraISBN:9781680331141Author:HOUGHTON MIFFLIN HARCOURTPublisher:Houghton Mifflin Harcourt
 Glencoe Algebra 1, Student Edition, 9780079039897...AlgebraISBN:9780079039897Author:CarterPublisher:McGraw Hill
 Algebra: Structure And Method, Book 1AlgebraISBN:9780395977224Author:Richard G. Brown, Mary P. Dolciani, Robert H. Sorgenfrey, William L. ColePublisher:McDougal Littell
Holt Mcdougal Larson Pre-algebra: Student Edition...
Algebra
ISBN:9780547587776
Author:HOLT MCDOUGAL
Publisher:HOLT MCDOUGAL
Elementary Algebra
Algebra
ISBN:9780998625713
Author:Lynn Marecek, MaryAnne Anthony-Smith
Publisher:OpenStax - Rice University
Big Ideas Math A Bridge To Success Algebra 1: Stu...
Algebra
ISBN:9781680331141
Author:HOUGHTON MIFFLIN HARCOURT
Publisher:Houghton Mifflin Harcourt
Glencoe Algebra 1, Student Edition, 9780079039897...
Algebra
ISBN:9780079039897
Author:Carter
Publisher:McGraw Hill
Algebra: Structure And Method, Book 1
Algebra
ISBN:9780395977224
Author:Richard G. Brown, Mary P. Dolciani, Robert H. Sorgenfrey, William L. Cole
Publisher:McDougal Littell
What Are Research Ethics?; Author: HighSchoolScience101;https://www.youtube.com/watch?v=nX4c3V23DZI;License: Standard YouTube License, CC-BY
What is Ethics in Research - ethics in research (research ethics); Author: Chee-Onn Leong;https://www.youtube.com/watch?v=W8Vk0sXtMGU;License: Standard YouTube License, CC-BY