Intro Stats Plus Student Solutions Manual (4th Edition)
4th Edition
ISBN: 9780321932815
Author: Richard D. De Veaux, Paul F. Velleman, David E. Bock
Publisher: PEARSON
expand_more
expand_more
format_list_bulleted
Concept explainers
Videos
Textbook Question
Chapter 25, Problem 20E
GPA and SATs A large section of Stat 101 was asked to fill out a survey on grade point average and SAT scores. A regression was run to find out how well Math and Verbal SAT scores could predict academic performance as measured by GPA. The regression was run on a computer package with the following output:
Response: GPA
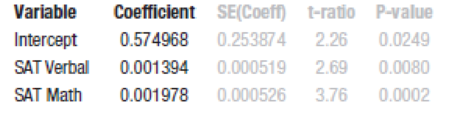
- a) What is the regression equation?
- b) From this model, what is the predicted GPA of a student with an SAT Verbal score of 500 and an SAT Math score of 550?
- c) What else would you want to know about this regression before writing a report about the relationship between SAT scores and grade point averages? Why would these be important to know?
Expert Solution & Answer
Want to see the full answer?
Check out a sample textbook solution
Chapter 25 Solutions
Intro Stats Plus Student Solutions Manual (4th Edition)
Ch. 25.4 - Prob. 1JCCh. 25.4 - Prob. 2JCCh. 25.4 - Prob. 3JCCh. 25 - Prob. 1ECh. 25 - Candy sales A candy maker surveyed chocolate bars...Ch. 25 - Prob. 3ECh. 25 - Prob. 4ECh. 25 - Prob. 5ECh. 25 - Prob. 6ECh. 25 - Prob. 7E
Ch. 25 - 8. More movie profit tests From the regression...Ch. 25 - Prob. 9ECh. 25 - Prob. 10ECh. 25 - Interpretations A regression performed to predict...Ch. 25 - Prob. 12ECh. 25 - Prob. 13ECh. 25 - Prob. 14ECh. 25 - Prob. 15ECh. 25 - Prob. 16ECh. 25 - Prob. 17ECh. 25 - Prob. 18ECh. 25 - 19. Secretary performance The AFL-CIO has...Ch. 25 - GPA and SATs A large section of Stat 101 was asked...Ch. 25 - 21. Body fat, revisited The data set on body fat...Ch. 25 - Prob. 22ECh. 25 - Prob. 23ECh. 25 - Prob. 24ECh. 25 - 25. Fifty states Here is a data set on various...Ch. 25 - Prob. 26ECh. 25 - Prob. 27E
Knowledge Booster


Learn more about
Need a deep-dive on the concept behind this application? Look no further. Learn more about this topic, statistics and related others by exploring similar questions and additional content below.Similar questions
- Life Expectancy The following table shows the average life expectancy, in years, of a child born in the given year42 Life expectancy 2005 77.6 2007 78.1 2009 78.5 2011 78.7 2013 78.8 a. Find the equation of the regression line, and explain the meaning of its slope. b. Plot the data points and the regression line. c. Explain in practical terms the meaning of the slope of the regression line. d. Based on the trend of the regression line, what do you predict as the life expectancy of a child born in 2019? e. Based on the trend of the regression line, what do you predict as the life expectancy of a child born in 1580?2300arrow_forward3.4 SKILL BUILDING EXERCISES Getting Regression Lines Only Find the equation of the regression line for the following data set. x 1 2 3 y 3 3 4arrow_forwardCellular Phone Subscribers The table shows the numbers of cellular phone subscribers y in millions in the United States from 2008 through 2013. Source: CTIA- The Wireless Association Year200820092010201120122013Number,y270286296316326336 (a) Find the least squares regression line for the data. Let x represent the year, with x=8 corresponding to 2008. (b) Use the linear regression capabilities of a graphing utility to find a linear model for the data. How does this model compare with the model obtained in part a? (c) Use the linear model to create a table of estimated values for y. Compare the estimated values with the actual data.arrow_forward
arrow_back_ios
arrow_forward_ios
Recommended textbooks for you
 Functions and Change: A Modeling Approach to Coll...AlgebraISBN:9781337111348Author:Bruce Crauder, Benny Evans, Alan NoellPublisher:Cengage Learning
 Glencoe Algebra 1, Student Edition, 9780079039897...AlgebraISBN:9780079039897Author:CarterPublisher:McGraw Hill
 Elementary Linear Algebra (MindTap Course List)AlgebraISBN:9781305658004Author:Ron LarsonPublisher:Cengage Learning
 Algebra & Trigonometry with Analytic GeometryAlgebraISBN:9781133382119Author:SwokowskiPublisher:Cengage
Functions and Change: A Modeling Approach to Coll...
Algebra
ISBN:9781337111348
Author:Bruce Crauder, Benny Evans, Alan Noell
Publisher:Cengage Learning
Glencoe Algebra 1, Student Edition, 9780079039897...
Algebra
ISBN:9780079039897
Author:Carter
Publisher:McGraw Hill
Elementary Linear Algebra (MindTap Course List)
Algebra
ISBN:9781305658004
Author:Ron Larson
Publisher:Cengage Learning
Algebra & Trigonometry with Analytic Geometry
Algebra
ISBN:9781133382119
Author:Swokowski
Publisher:Cengage
Correlation Vs Regression: Difference Between them with definition & Comparison Chart; Author: Key Differences;https://www.youtube.com/watch?v=Ou2QGSJVd0U;License: Standard YouTube License, CC-BY
Correlation and Regression: Concepts with Illustrative examples; Author: LEARN & APPLY : Lean and Six Sigma;https://www.youtube.com/watch?v=xTpHD5WLuoA;License: Standard YouTube License, CC-BY