
APPLICATIONS+INVESTIGATIONS IN EARTH
18th Edition
ISBN: 9781533902405
Author: Tarbuck
Publisher: Hayden-McNeil Publishing
expand_more
expand_more
format_list_bulleted
Textbook Question
Chapter 2.5, Problem 6A
Carefully examine the common sedimentary rocks shown In Figure 2.13. Use these photos and the preceding discussion to answer the following questions.
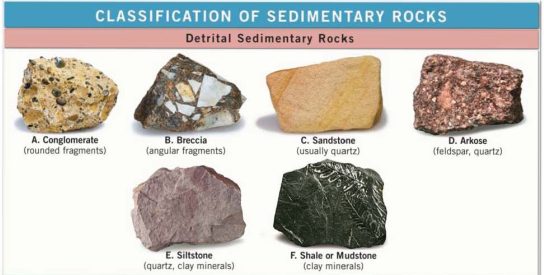
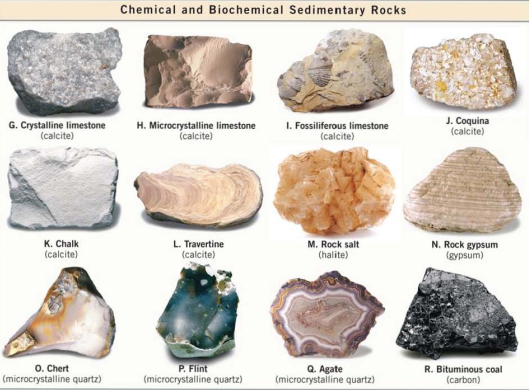
Sample G (crystalline limestone) in Figure 2.13 and Sample F (granite) in Figure 2.11 are both crystalline. How do these samples differ in appearance?
Expert Solution & Answer

Learn your wayIncludes step-by-step video

schedule02:31
Students have asked these similar questions
What is the best measure of dispersion
can you please show me how to form the equation of value here , using the bisection method
Select and consider real-world assets and their correlation. Identify and discuss two assets or variables that exhibit a near - perfect positive correlation.. Identify and discuss two assets or variables that exhibit a near - perfect negative correlation. Discuss if the correlations are constant or dynamic. Explain the correlated relationship; also discuss validity of the data set and reading level.
Chapter 2 Solutions
APPLICATIONS+INVESTIGATIONS IN EARTH
Ch. 2.1 - Label the rock cycle diagram In Figure 2.3 Figure...Ch. 2.1 - What is magma? How does magma differ from lava?Ch. 2.1 - The terms intrusive and extrusive are used to...Ch. 2.1 - In your own words, write a definition of rock...Ch. 2.1 - Name the process by which sediment is transformed...Ch. 2.1 - What is the most characteristic feature of...Ch. 2.1 - What type of rock is generated when rocks that...Ch. 2.1 - When determining rock composition, describe the...Ch. 2.2 - Which samples A- H exhibits porphyritic texture?Ch. 2.2 - For the samples you listed in Question 1, whal...
Ch. 2.2 - Which samples in Figure 2.9 exhibits...Ch. 2.2 - Complete the description of the environment which...Ch. 2.2 - Which samples in Figure 2.9 exhibits fine-grained...Ch. 2.2 - Complete the description of the environment which...Ch. 2.2 - Which samples in Figure 2.9 exhibits vesicular...Ch. 2.2 - Which samples in Figure 2.9 exhibits glassy...Ch. 2.2 - Although Samples A and C In Figure 2.9 appear...Ch. 2.3 - Use the color Index shown at the bottom of Figure...Ch. 2.3 - Use the color Index shown at the bottom of Figure...Ch. 2.3 - Use the color Index shown at the bottom of Figure...Ch. 2.4 - Place each of the igneous rocks supplied by your...Ch. 2.5 - Carefully examine the common sedimentary rocks...Ch. 2.5 - Carefully examine the common sedimentary rocks...Ch. 2.5 - Carefully examine the common sedimentary rocks...Ch. 2.5 - Carefully examine the common sedimentary rocks...Ch. 2.5 - Carefully examine the common sedimentary rocks...Ch. 2.5 - Carefully examine the common sedimentary rocks...Ch. 2.5 - Carefully examine the common sedimentary rocks...Ch. 2.5 - Carefully examine the common sedimentary rocks...Ch. 2.5 - Carefully examine the common sedimentary rocks...Ch. 2.5 - What mineral does Sample D contain that gives it a...Ch. 2.6 - Prob. 1ACh. 2.7 - Use Figure 2.16 to identify the environments A- L...Ch. 2.7 - Briefly describe the environment that is...Ch. 2.7 - The rocks in Zion National Park, Utah, consist of...Ch. 2 - The rock samples you encountered while completing...Ch. 2 - Match each of the metamorphic rocks listed below...Ch. 2 - Match each term or characteristics with the...Ch. 2 - Identify the folliated metamorphic rocks shown In...Ch. 2 - Identify each of the rocks shown in Figure 2.26...
Additional Business Textbook Solutions
Find more solutions based on key concepts
Why does your soft drink can “sweat” more in the summer than in the winter?
Exercises for Weather & Climate (9th Edition)
What is the difference between cellular respiration and external respiration?
Human Physiology: An Integrated Approach (8th Edition)
1. Which parts of the skeleton belong to the appendicular skeleton? Which belong to the axial skeleton?
Human Anatomy & Physiology
The following variances were calculated for two traits in a herd of hogs. (a) Calculate broad-sense (H2) and na...
Concepts of Genetics (11th Edition)
53. This reaction was monitored as a function of time:
A plot of In[A] versus time yields a straight ...
Chemistry: Structure and Properties
1. When were the Bohr model the quantum-mechanical model for the atom developed? What purpose do these models s...
Introductory Chemistry (5th Edition) (Standalone Book)
Knowledge Booster

Similar questions
- Suppose you're given a data set that classifies each sample unit into one of four categories: A, B, C, the data as A = 1, B=2, C = 3, and D=4. Are the data consisting of the classifications A, B, C, and D or quantitative? Are the data consisting of the classifications A, B, C, and D qualitiative or quantitative? OA. Qualitative, because they are measured on a naturally occuring numerical scale. B. Quantitative, because they are measured on a naturally occuring numerical scale. C. Quantitative, because they can only be classified into categories. D. Qualitative, because they can only be classified into categories. *** After the data are input as 1, 2, 3, or 4, are they qualitative or quantitative? OA. Qualitative, because they cannot be meaningfully added, subtracted, multiplied, or divided. B. Qualitative, because they are measured on a naturally occurring numerical scale. OC. Quantitative, because they are measured on a naturally occurring numerical scale. OD. Quantitative, because…arrow_forwardWhich of the following statements is correct with respect to a Gantt chart?a. The x-axis of a Gantt chart shows a time line.b. The y-axis shows the activities of a project.c. The Gantt chart itself does not show all dependencies among activities.d. The Gantt chart is named after 19th-century industrialist Henry Gantt.e. All of these statements are correct.arrow_forwardBriefly explain the assumptions in each of the following analysis 1)Tecnical anslysis 2)Fundamental analysisarrow_forward
- What are the two main variables the researcher should consider collecting data for the purpose of the above analysis and why? Identify the data type(s) for the variablesarrow_forwardWhat can you see from horizontal analysis? Or comment briefly on the facts revealed by your analysis.arrow_forwardTHE FIRST PICTURE IS TO Create an View Point for this study analysis. The second picture is the problem/ basis.arrow_forward
- Explain the following concepts? a. Off-sheet analysis. b. Horizontal analysis. c. Vertical analysis. d. Time-value analysis.arrow_forwardGive an example where researchers have used an event study and what did they find? Was it consistent with the EMH?arrow_forwardAn Optical Spectrometer. You and your team are tasked with characterizing an equilateral, triangular prism to be used in an optical spectrometer. An optical spectrometer contains a dispersive element (in this case, the prism) that separates an incoming beam of light into its constituent wavelengths (or colors), and a photocell that measures the intensity of each color (wavelength) by measuring the intensity of the dispersed light as a function of angle. The index of refraction of the prism material you are using depends on the wavelength as n(A)=(1.111 x 10⁴ nm¹) A (nm) + 1.609 An incident beam of white light impinges on the surface (see drawing) at an angle of 42.2 degrees below the normal. The prism is in air (n = 1.000). Normal Ꮎ Red (660 nm) Violet (410 nm) (a) Relative to the prism base (i.e., the horizontal in the drawing), at what angle does red light (A-660.0 nm) emerge on the opposite side? (b) Relative to the prism base (i.e., the horizontal in the drawing), at what angle…arrow_forward
- What are the two major types of tests that have been performed totest the validity of the CAPM? (beta stability; slope of the SML)Explain their results.arrow_forwardCan you help with the spread sheet sample of how it will be so as to help me do my study work perfectlyarrow_forwardDescribe in words how an NPV profile is constructed. How are the intercepts of theX- and Y-axes determined?arrow_forward
arrow_back_ios
SEE MORE QUESTIONS
arrow_forward_ios
Recommended textbooks for you
 Auditing: A Risk Based-Approach to Conducting a Q...AccountingISBN:9781305080577Author:Karla M Johnstone, Audrey A. Gramling, Larry E. RittenbergPublisher:South-Western College Pub
 Auditing: A Risk Based-Approach (MindTap Course L...AccountingISBN:9781337619455Author:Karla M Johnstone, Audrey A. Gramling, Larry E. RittenbergPublisher:Cengage Learning
 Cornerstones of Financial AccountingAccountingISBN:9781337690881Author:Jay Rich, Jeff JonesPublisher:Cengage Learning
 Survey of Accounting (Accounting I)AccountingISBN:9781305961883Author:Carl WarrenPublisher:Cengage Learning
Auditing: A Risk Based-Approach to Conducting a Q...
Accounting
ISBN:9781305080577
Author:Karla M Johnstone, Audrey A. Gramling, Larry E. Rittenberg
Publisher:South-Western College Pub
Auditing: A Risk Based-Approach (MindTap Course L...
Accounting
ISBN:9781337619455
Author:Karla M Johnstone, Audrey A. Gramling, Larry E. Rittenberg
Publisher:Cengage Learning
Cornerstones of Financial Accounting
Accounting
ISBN:9781337690881
Author:Jay Rich, Jeff Jones
Publisher:Cengage Learning
Survey of Accounting (Accounting I)
Accounting
ISBN:9781305961883
Author:Carl Warren
Publisher:Cengage Learning