
Concept explainers
Videos
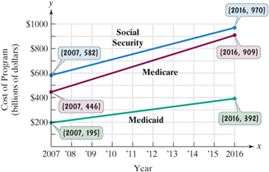
In 2007, the U.S. government faced the prospect of paying out more and more in social security, Medicare, and Medicaid benefits. The line graphs shows the costs of these of these entitlement programs, in billions of dollars, from 2007 through 2016 (projected).Use this information to solve Exercises 71 – 72on the page.
Cost in Billions of dollars of the Largest Federal Entitlement Programs
(In Exercises 71–72 refer to the graphs at the bottom of the previous page.)
a. Find the slope of the line segment representing social security. Round to one decimal place. Describe what this means in terms of rate of change.
b. Find the slope of the line segment representing Medicaid. Round to one decimal place. Describe what this means in terms in of rate of change.
c. Do the line segments for social security and Medicaid lines? What this in terms of the rate of change for these for these entitlement programs?
Want to see the full answer?
Check out a sample textbook solution
Chapter 2 Solutions
Intermediate Algebra for College Students (7th Edition)


- The municipal transit authority serves 150,000 commuters daily when the fare is $1.80. Market research has determined that every penny decrease in the fare will result in 1,000 new riders. What will maximize the revenue?arrow_forwardHow many objects should be sold to maximize profit?arrow_forwardThe Transit Authority (TA)in a metropolitan area operates a subway line that currently carries an average of 6000 passengers per day commuting between the suburbs and downtown. The fare now is $3.00 per ride and the board of the TA is considering raising its price by $0.50 to generate a larger revenue. A study reveals that for each $0.50 increase in fare, the ridership will be reduced by an average of 1000 passengers per day. Using this study, the board determines that, to get maximum profit, the price of the ticket should remain at $3.00. Is this correct? Explain why or why not.arrow_forward
- A city's transit authority serves 180,000 commuters daily when the fare is $1.70. Market research has determined that every penny decrease in the fare will result in 1,200 new riders. What fare will maximize revenue?arrow_forwardDescribe the graphs of the equations in Exercises 3 and 4. 3. x2 + y2 = 1 4. x2 + y2 <= 3arrow_forwardWhat does the fish population of the lake approach in the long run?arrow_forward
- Ron attends a cocktail party (with his graphing calculator in his pocket). He wants to limit his food intake to 143 g protein, 130 g fat, and 162 g carbohydrate. According to the health conscious hostess, the marinated mushroom caps have 3 g protein, 5 g fat, and 9 g carbohydrate; the spicy meatballs have 14 g protein, 7 g fat, and 15 g carbohydrate; and the deviled eggs have 13 g protein, 15 g fat, and 6 g carbohydrate. How many of each snack can he eat to obtain his goal?arrow_forwardThe following graph shows the labor market for research assistants in the fictional country of Collegia. The equilibrium wage is $10 per hour, and the equilibrium number of research assistants is 200. Suppose the government has decided to institute a $2-per-hour payroll tax on research assistants and is trying to determine whether the tax should be levied on the employer, the workers, or both (such that half the tax is collected from each side). Use the graph input tool to evaluate these three proposals. Entering a number into the Tax Levied on Employers field (initially set at zero dollars per hour) shifts the demand curve down by the amount you enter, and entering a number into the Tax Levied on Workers field (initially set at zero dollars per hour) shifts the supply curve up by the amount you enter. To determine the before-tax wage for each tax proposal, adjust the amount in the Wage field until the quantity of labor supplied equals the quantity of labor demanded. You will not be…arrow_forwardgraph also needarrow_forward
- The manager of a 100-unit apartment complex knows from experience that all units will be occupied if the rent is $500 per month. A market survey suggest that, on average, one additional unit will remain vacant for each $10 increase in rent. What rent should the manager charge to maximize revenue?arrow_forwardThe bar graph shows the estimated number of calories per day needed to maintain energy balance for various gender and age groups for moderately active lifestyles.The mathematical modelM = -120x2 + 998x + 590describes the number of calories needed per day, M, by men in age group x with moderately active lifestyles. According to the model, how many calories per day are needed by men between the ages of 19 and 30, inclusive, with this lifestyle? Does this underestimate or overestimate the number shown by the graph? By how much?arrow_forwardHow many units of each chemical should be purchased to maximize production of chemical Z? What is the maximum number of units of chemical Z?arrow_forward
 Linear Algebra: A Modern IntroductionAlgebraISBN:9781285463247Author:David PoolePublisher:Cengage Learning
 Algebra & Trigonometry with Analytic GeometryAlgebraISBN:9781133382119Author:SwokowskiPublisher:Cengage