(a)
Interpretation:
The working method of ion mobility spectrometry should be describes and analogies between gas-phase electrophoresis and capillary electrophoresis should be given.
Concept introduction:
Ion mobility spectrometry:
The electrophoretic mobility is given by the constant of proportionality between the electric field strength and speeds of the ion.
Capillary electrophoresis:
The movement of solute particle respect with the applied electric field is known as electrophoresis, this electrophoresis is produced in capillary tube is known as capillary electrophoresis.
(a)
Explanation of Solution
To describe the working method of ion mobility spectrometry.
The analyte are converted into gaseous ions by irradiation of analyte plus reagent gas like acetone in air with
The produced ions are passed through a tube, which has the grid with short voltage to plus the ions.
The ions are experience the constant electrical field in the grid. The ions are detected by the detectors, which the time they are drift.
The speed of the ion respect with the applied constant short voltage of the grid and friction force of the tube are noted.
Electrophoretic mobility is the constant of proportionality between the electric field strength and speeds of the ion.
Here, f is the friction coefficient.
From the above collected data are plugged in above equation to find the electrophoretic mobility of ion in electrophoresis, the ions are separated by resulted electrophoretic mobility of ions.
To give the analogies between gas-phase electrophoresis and capillary electrophoresis.
The drift time in the capillary electrophoresis same as the capillary electrophoresis.
The applied electrical field is a driving force of ions to migrate source to detector in capillary electrophoresis and same as in gas-phase electrophoresis.
The mobility of the ion in gas-phase electrophoresis and capillary electrophoresis is governed by charge to size ration.
The smaller size higher charge ions are have greater mobility.
The retarding force of the liquids and gases in gas-phase electrophoresis and capillary electrophoresis is caused by collision with medium.
The working method of ion mobility spectrometry was describes and analogies between gas-phase electrophoresis and capillary electrophoresis was given.
(b)
Interpretation:
The shape of curve in graph of plate number (vs) voltage in ion mobility spectrometry should be explained and the disadvantage of
Concept introduction:
Ion mobility spectrometry:
The electrophoretic mobility is given by the constant of proportionality between the electric field strength and speeds of the ion.
The peak width of the Ion mobility spectrometry is given by,
Where,
From the above equation the plate number is,
Where,
(b)
Explanation of Solution
To describe the working method of ion mobility spectrometry.
To draw the graph plate number (vs) voltage in ion mobility spectrometry.
Given,
Temperature
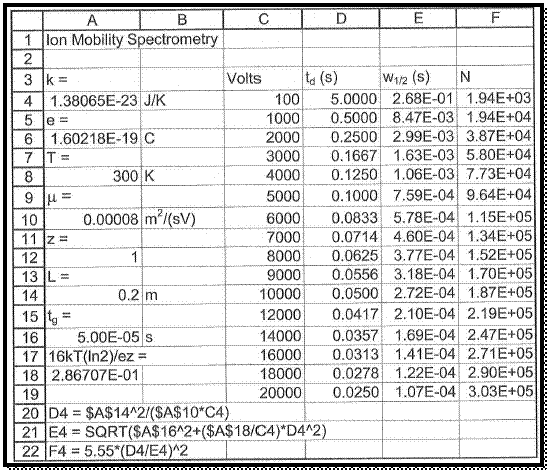
The give data and give formula are plugged in the spread sheet and apply the spread sheet formatted formula to calculate the required values and to prepare a graph of N (vs) Voltage
To take a new spread sheet and type the heading, which is shown in figure 1 and enter the observed values in the respective columns as pre heading.
The spread sheet format formulas are entered in column A same as shown in figure 1.
The values of plate number N respect with voltage are manipulated by the formula, which is already entered in spread sheet.

Figure 1
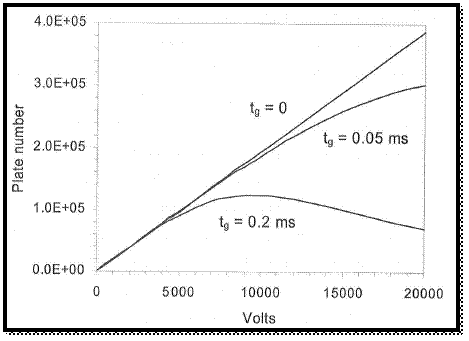
The graph is drawn by using values, which is in spread sheet.

Figure 2
From the above graph, the applied voltage is increases the number of plats.
The broadening of peak is resulted by the decreasing of tome to diffusion and the initial peak width is increases with the increasing of gate open time of ion hence the plot number is decreased.
Therefore, the peak is not obtained in narrowed than the plus that admitted by the gate.
To give the disadvantage of
At the high voltage, the
The shape of curve in graph of plate number (vs) voltage in ion mobility spectrometry was explained and the disadvantage of
(c)
Interpretation:
The reason for the decreasing T increase N in ion mobility spectrometry should be given.
Concept introduction:
Ion mobility spectrometry:
The electrophoretic mobility is given by the constant of proportionality between the electric field strength and speeds of the ion.
The peak width of the Ion mobility spectrometry is given by,
Where,
From the above equation the plate number is,
Where,
(c)
Explanation of Solution
To give the reason for the decreasing T increase N in ion mobility spectrometry.
The peak width of the Ion mobility spectrometry is given by,
The equation for the plate number is,
From the above equation 1, the temperature is directly proportional peak width and in equation 2 the number of plates is indirectly proportional to the peak width. Therefore decreasing temperature is increasing number of plates because of broadening of peak is decreases with decreasing temperature.
The reason for the decreasing T increase N in ion mobility spectrometry was given.
(d)
Interpretation:
The theoretical plate number of given mobility spectrometry should be calculated.
Concept introduction:
Ion mobility spectrometry:
The electrophoretic mobility is given by the constant of proportionality between the electric field strength and speeds of the ion.
The peak width of the Ion mobility spectrometry is given by,
Where,
From the above equation the plate number is,
Where,
(d)
Answer to Problem 26.50P
The theoretical plate number is
Explanation of Solution
To calculate the theoretical plate number of given mobility spectrometry.
Given,
The equation for the plate number is,
The theoretical plate number is,
The calculated width of the peak and
The theoretical plate number is
The theoretical plate number of given ion mobility spectrometry was calculated.
(e)
Interpretation:
The resolution of the given two peaks of ion mobility spectrometry should be calculated.
Concept introduction:
Resolution:
The difference in the two peaks, which are obtained in the same experiment in same condition is given by resolution.
In the chromatographic separation, the resolution is,
Where,
(e)
Answer to Problem 26.50P
The resolution of the given two peaks of ion mobility spectrometry is
Explanation of Solution
To calculate the resolution of the given two peaks of ion mobility spectrometry.
Given,
Number of plates
Resolution of given two peaks is,
The difference in the apparent mobility of the ions, number of plates, and average apparent mobility are plugged in above equation to give the Resolution of given two peaks.
Resolution of given two peaks is
The resolution of the given two peaks of ion mobility spectrometry was calculated.
Want to see more full solutions like this?
Chapter 26 Solutions
QUANTIT.CHEM..(LL)-W/WEBASSIGN(6 MONTH)
 ChemistryChemistryISBN:9781305957404Author:Steven S. Zumdahl, Susan A. Zumdahl, Donald J. DeCostePublisher:Cengage Learning
 ChemistryChemistryISBN:9781259911156Author:Raymond Chang Dr., Jason Overby ProfessorPublisher:McGraw-Hill Education
 Principles of Instrumental AnalysisChemistryISBN:9781305577213Author:Douglas A. Skoog, F. James Holler, Stanley R. CrouchPublisher:Cengage Learning
 Organic ChemistryChemistryISBN:9780078021558Author:Janice Gorzynski Smith Dr.Publisher:McGraw-Hill Education
 Chemistry: Principles and ReactionsChemistryISBN:9781305079373Author:William L. Masterton, Cecile N. HurleyPublisher:Cengage Learning
 Elementary Principles of Chemical Processes, Bind...ChemistryISBN:9781118431221Author:Richard M. Felder, Ronald W. Rousseau, Lisa G. BullardPublisher:WILEY


