
Concept explainers
Videos
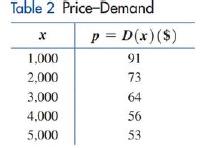
Supply and demand. A cordless screwdriver is sold through a national chain of discount stores. A marketing company established price-demand and price-supply tables (Tables
(A) Find a logarithmic regression model
(B) Find a logarithmic regression model
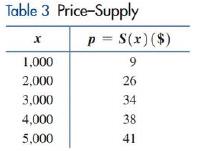
(C) Does a price level of
Want to see the full answer?
Check out a sample textbook solution
Chapter 2 Solutions
Finite Mathematics for Business, Economics, Life Sciences and Social Sciences
Additional Math Textbook Solutions
Calculus Volume 2
Using & Understanding Mathematics: A Quantitative Reasoning Approach (7th Edition)
Probability and Statistics for Engineers and Scientists
Thinking Mathematically (7th Edition)
A Survey of Mathematics with Applications (10th Edition) - Standalone book
Mathematics All Around (6th Edition)


- What does the y -intercept on the graph of a logistic equation correspond to for a population modeled by that equation?arrow_forwardSales of a video game released in the year 2000 took off at first, but then steadily slowed as time moved on. Table 4 shows the number of games sold, in thousands, from the years 20002010. a. Let x represent time in years starting with x=1 for the year 2000. Let y represent the number of games sold in thousands. Use logarithmic regression to fit a model to these data. b. If games continue to sell at this rate, how many games will sell in 2015? Round to the nearest thousand.arrow_forwardTable 6 shows the population, in thousands, of harbor seals in the Wadden Sea over the years 1997 to 2012. a. Let x represent time in years starting with x=0 for the year 1997. Let y represent the number of seals in thousands. Use logistic regression to fit a model to these data. b. Use the model to predict the seal population for the year 2020. c. To the nearest whole number, what is the limiting value of this model?arrow_forward
- World Population The following table shows world population N, in billions, in the given year. Year 1950 1960 1970 1980 1990 2000 2010 N 2.56 3.04 3.71 4.45 5.29 6.09 6.85 a. Use regression to find a logistic model for world population. b. What r value do these data yield for humans on planet Earth? c. According to the logistic model using these data, what is the carrying capacity of planet Earth for humans? d. According to this model, when will world population reach 90 of carrying capacity? Round to the nearest year. Note: This represents a rather naive analysis of world population.arrow_forwardThe following fictitious table shows kryptonite price, in dollar per gram, t years after 2006. t= Years since 2006 0 1 2 3 4 5 6 7 8 9 10 K= Price 56 51 50 55 58 52 45 43 44 48 51 Make a quartic model of these data. Round the regression parameters to two decimal places.arrow_forwardLong-Term Data and the Carrying Capacity This is a continuation of Exercise 13. Ideally, logistic data grow toward the carrying capacity but never go beyond this limiting value. The following table shows additional data on paramecium cells. t 12 13 14 15 16 17 18 19 20 N 610 513 593 557 560 522 565 517 500 a. Add these data to the graph in part b of Exercise 13. b. Comment on the relationship of the data to the carrying capacity. Paramecium Cells The following table is adapted from a paramecium culture experiment conducted by Cause in 1934. The data show the paramecium population N as a function of time t in days. T 2 3 5 6 8 9 10 11 N 14 34 94 189 330 416 507 580 a. Use regression to find a logistic model for this population. b. Make a graph of the model you found in part a. c. According to the model you made in part a, when would the population reach 450?arrow_forward
- Olympic Pole Vault The graph in Figure 7 indicates that in recent years the winning Olympic men’s pole vault height has fallen below the value predicted by the regression line in Example 2. This might have occurred because when the pole vault was a new event there was much room for improvement in vaulters’ performances, whereas now even the best training can produce only incremental advances. Let’s see whether concentrating on more recent results gives a better predictor of future records. (a) Use the data in Table 2 (page 176) to complete the table of winning pole vault heights shown in the margin. (Note that we are using x=0 to correspond to the year 1972, where this restricted data set begins.) (b) Find the regression line for the data in part ‚(a). (c) Plot the data and the regression line on the same axes. Does the regression line seem to provide a good model for the data? (d) What does the regression line predict as the winning pole vault height for the 2012 Olympics? Compare this predicted value to the actual 2012 winning height of 5.97 m, as described on page 177. Has this new regression line provided a better prediction than the line in Example 2?arrow_forwardTable 2 shows a recent graduate’s credit card balance each month after graduation. a. Use exponential regression to fit a model to these data. b. If spending continues at this rate, what will the graduate’s credit card debt be one year after graduating?arrow_forward

 Functions and Change: A Modeling Approach to Coll...AlgebraISBN:9781337111348Author:Bruce Crauder, Benny Evans, Alan NoellPublisher:Cengage Learning
 College AlgebraAlgebraISBN:9781305115545Author:James Stewart, Lothar Redlin, Saleem WatsonPublisher:Cengage Learning
 Linear Algebra: A Modern IntroductionAlgebraISBN:9781285463247Author:David PoolePublisher:Cengage Learning