Problem 1CVC: 1. We exclude from a function's domain real numbers that cause division by____
Problem 2CVC: 2. We exclude from a function's domain real numbers that result in a square root of a/an ______... Problem 3CVC: Fill in each blank so that the resulting statement is true. (f+g)(x)= ____ Problem 4CVC: Fill in each blank so that the resulting statement is true. (fg)(x)= ____ Problem 5CVC: Fill in each blank so that the resulting statement is true. (fg)(x)= ____ Problem 6CVC: Fill in each blank so that the resulting statement is true. fg(x)= ______ provided ____ 0 Problem 7CVC: Fill in each blank so that the resulting statement is true.
7. The domain of consists of all real... Problem 8CVC Problem 9CVC Problem 10CVC: The notation fg, called the _________ of the function f with g, is defined by (fg)(x)= ____ Problem 11CVC Problem 12CVC Problem 13CVC Problem 14CVC Problem 15CVC Problem 16CVC: Fill in each blank so that the resulting statement is true. If f(g(x))=3g(x)4 and g(x)=8x, then 0... Problem 1E: In Exercises 1-30, find the domain of each function.
1.
Problem 2E: In Exercises 1-30, find the domain of each function. f(x)2(x+5) Problem 3E: In Exercises 1-30, find the domain of each function. g(x)=3x4 Problem 4E: In Exercises 1-30, find the domain of each function.
4.
Problem 5E: In Exercises 1-30, find the domain of each function.
5.
Problem 6E: In Exercises 1-30, find the domain of each function.
6.
Problem 7E: In Exercises 1-30, find the domain of each function. g(x)=3x22x15 Problem 8E Problem 9E: In Exercises 1-30, find the domain of each function. f(x)=1x+7+3x9 Problem 10E: In Exercises 1-30, find the domain of each function.
10.
Problem 11E: In Exercises 1-30, find the domain of each function.
11.
Problem 12E: In Exercises 1-30, find the domain of each function. g(x)=1x2+41x24 Problem 13E: In Exercises 1-30, find the domain of each function.
13.
Problem 14E: In Exercises 1-30, find the domain of each function. h(x)54x1 Problem 15E: In Exercises 1-30, find the domain of each function.
15.
Problem 16E: In Exercises 1-30, find the domain of each function.
16.
Problem 17E: In Exercises 1-30, find the domain of each function.
17.
Problem 18E: In Exercises 1-30, find the domain of each function. f(x)=x+2 Problem 19E: In Exercises 1-30, find the domain of each function. g(x)=1x3 Problem 20E: In Exercises 1-30, find the domain of each function. g(x)=1x+2 Problem 21E: In Exercises 1-30, find the domain of each function.
21.
Problem 22E: In Exercises 1-30, find the domain of each function.
22.
Problem 23E: In Exercises 1-30, find the domain of each function. f(x)=242x Problem 24E: In Exercises 1-30, find the domain of each function.
24.
Problem 25E: In Exercises 1-30, find the domain of each function. h(x)=x2+x+3 Problem 26E: In Exercises 1-30, find the domain of each function.
26.
Problem 27E: In Exercises 1-30, find the domain of each function. g(x)=x2x5 Problem 28E: In Exercises 1-30, find the domain of each function.
28.
Problem 29E: In Exercises 1-30, find the domain of each function. f(x)=2x+7x35x24x+20 Problem 30E: In Exercises 1-30, find the domain of each function. f(x)=7x+2x32x29x18 Problem 31E: In Exercises 31-50, find , and . Determine the domain for each function.
31.
Problem 32E: In Exercises 31-50, find , and . Determine the domain for each function.
32.
Problem 33E: In Exercises 31-50, find f+g,fg,fg , and 1g . Determine the domain for each function.... Problem 34E: In Exercises 31-50, find , and . Determine the domain for each function.
34.
Problem 35E: In Exercises 31-50, find f+g,fg,fg , and 1g . Determine the domain for each function.... Problem 36E: In Exercises 31-50, find , and . Determine the domain for each function.
36.
Problem 37E: In Exercises 31-50, find , and . Determine the domain for each function.
37.
Problem 38E: In Exercises 31-50, find , and . Determine the domain for each function.
38.
Problem 39E: In Exercises 31-50, find f+g,fg,fg , and 1g . Determine the domain for each function. f(x)=x,g(x)=x4 Problem 40E: In Exercises 31-50, find , and . Determine the domain for each function.
40.
Problem 41E: In Exercises 31-50, find , and. Determine the domain for each function.
41.
Problem 42E: In Exercises 31-50, find , and . Determine the domain for each function.
42.
Problem 43E: In Exercises 31-50, find f+g,fg,fg , and 1g . Determine the domain for each function.... Problem 44E: In Exercises 31-50, find f+g,fg,fg , and 1g . Determine the domain for each function.... Problem 45E: In Exercises 31-50, find f+g,fg,fg , and 1g . Determine the domain for each function.... Problem 46E: In Exercises 31-50, find , and . Determine the domain for each function.
46.
Problem 47E: In Exercises 31-50, find f+g,fg,fg , and 1g . Determine the domain for each function.... Problem 48E: In Exercises 31-50, find , and . Determine the domain for each function.
48.
Problem 49E: In Exercises 31-50, find , and . Determine the domain for each function.
49.
Problem 50E: In Exercises 31-50, find f+g,fg,fg , and 1g . Determine the domain for each function.... Problem 51E: In Exercises 51-66, find a. (fg)(x) b. (gf)(x) c. (fg)(2) d. (gf)(2). f(x)=2x,g(x)=x+7 Problem 52E: In Exercises 51-66, find a. (fg)(x) b. (gf)(x) c. (fg)(2) d. (gf)(2). f(x)=3x,g(x)=x5 Problem 53E: In Exercises 51-66, find
a.
b.
c.
d.
53.
Problem 54E: In Exercises 51-66, find a. (fg)(x) b. (gf)(x) c. (fg)(2) d. (gf)(2). f(x)=5x+2,g(x)=3x4 Problem 55E: In Exercises 51-66, find
a.
b.
c.
d. .
55.
Problem 56E: In Exercises 51-66, find a. (fg)(x) b. (gf)(x) c. (fg)(2) d. (gf)(2). f(x)7x+1,g(x)=2x29 Problem 57E: In Exercises 51-66, find a. (fg)(x) b. (gf)(x) c. (fg)(2) d. (gf)(2). f(x)=x2+2,g(x)=x22 Problem 58E: In Exercises 51-66, find a. (fg)(x) b. (gf)(x) c. (fg)(2) d. (gf)(2). f(x)=x2+1,g(x)=x23 Problem 59E: In Exercises 51-66, find a. (fg)(x) b. (gf)(x) c. (fg)(2) d. (gf)(2). f(x)=4x,g(x)=2x2+x+5 Problem 60E: In Exercises 51-66, find a. (fg)(x) b. (gf)(x) c. (fg)(2) d. (gf)(2). f(x)=5x2,g(x)=x2+4x1 Problem 61E Problem 62E: In Exercises 51-66, find a. (fg)(x) b. (gf)(x) c. (fg)(2) d. (gf)(2). f(x)=x,g(x)=x+2 Problem 63E: In Exercises 51-66, find
a.
b.
c.
d. .
63.
Problem 64E: In Exercises 51-66, find a. (fg)(x) b. (gf)(x) c. (fg)(2) d. (gf)(2). f(x)=6x3,g(x)=x+36 Problem 65E: In Exercises 51-66, find
a.
b.
c.
d. .
65.
Problem 66E: In Exercises 51-66, find a. (fg)(x) b. (gf)(x) c. (fg)(2) d. (gf)(2). f(x)=2x,g(x)=2x Problem 67E: In Exercises 67-74, find
a.
b. the domain of .
67.
Problem 68E: In Exercises 67-74, find a. (fg)(x) b. the domain of fg. f(x)=5x+4,g(x)=1x Problem 69E: In Exercises 67-74, find a. (fg)(x) b. the domain of fg. f(x)=xx+1,g(x)=4x Problem 70E: In Exercises 67-74, find a. (fg)(x) b. the domain of fg. f(x)=xx+5,g(x)=6x Problem 71E: In Exercises 67-74, find
a.
b. the domain of .
71.
Problem 72E: In Exercises 67-74, find a. (fg)(x) b. the domain of fg. f(x)=x,g(x)=x3 Problem 73E: In Exercises 67-74, find a. (fg)(x) b. the domain of fg. f(x)=x2+4,g(x)=1x Problem 74E: In Exercises 67-74, find a. (fg)(x) b. the domain of fg. f(x)=x2+1,g(x)=2x Problem 75E: In Exercises 75-82, express the given function h as a composition of two functions f and g so that... Problem 76E Problem 77E: In Exercises 75-82, express the given function h as a composition of two functions f and g so that... Problem 78E Problem 79E: In Exercises 75-82, express the given function h as a composition of two functions f and g so that... Problem 80E Problem 81E: In Exercises 75-82, express the given function h as a composition of two functions f and g so that... Problem 82E Problem 83E: Practice Plus Use the graphs of f and g to solve Exercises 83-90. Find (f+g)(3). Problem 84E: Practice Plus Use the graphs of f and g to solve Exercises 83-90. Find (gf)(3). Problem 85E: Practice Plus Use the graphs of f and g to solve Exercises 83-90. Find (f g) (2). Problem 86E: Practice Plus Use the graphs of f and g to solve Exercises 83-90. Find (gf)(3). Problem 87E: Practice Plus
Use the graphs of f and g to solve Exercises 83-90.
87. Find the domain of .
Problem 88E: Practice Plus
Use the graphs of f and g to solve Exercises 83-90.
88. Find the domain of .
Problem 89E Problem 90E Problem 91E: In Exercises 91-94, use the graphs of f and g to evaluate each composite function.
91.
Problem 92E: In Exercises 91-94, use the graphs of f and g to evaluate each composite function. (fg)(1) Problem 93E: In Exercises 91-94, use the graphs of f and g to evaluate each composite function.
93.
Problem 94E: In Exercises 91-94, use the graphs of f and g to evaluate each composite function. (gf)(1) Problem 95E: In Exercises 95-96, find all values of x satisfying the given conditions.
95. .
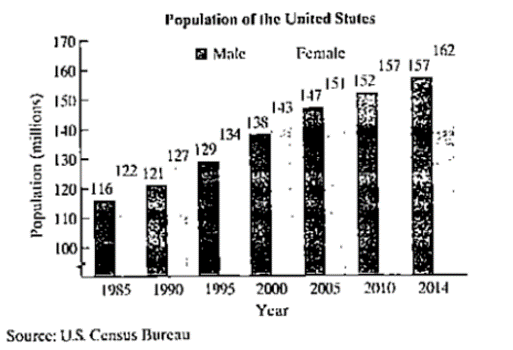
Problem 96E Problem 97E: The bar graph shows the population of the United States in millions for seven selected years.
Here... Problem 98E: The bar graph shows the population of the United States in millions for seven selected years.
Here... Problem 99E Problem 100E Problem 101E Problem 102E: The regular price of a pair of jeans is x dollars. Let f(x)=x5 and g(x)=0.6x. a. Describe what... Problem 103E Problem 104E Problem 105E Problem 106E Problem 107E Problem 108E Problem 109E Problem 110E Problem 111E Problem 112E Problem 113E Problem 114E Problem 115E Problem 116E: In Exercises 114-117, determine whether each statement is true or false. If the statement is false,... Problem 117E Problem 118E: Prove than if f and g are even functions, then fg is also an even function. Problem 119E Problem 120E Problem 121E Problem 122E Problem 123E Problem 124E Problem 125E format_list_bulleted


 College AlgebraAlgebraISBN:9781305115545Author:James Stewart, Lothar Redlin, Saleem WatsonPublisher:Cengage Learning
 College Algebra (MindTap Course List)AlgebraISBN:9781305652231Author:R. David Gustafson, Jeff HughesPublisher:Cengage Learning
 Algebra and Trigonometry (MindTap Course List)AlgebraISBN:9781305071742Author:James Stewart, Lothar Redlin, Saleem WatsonPublisher:Cengage Learning
 Elementary Linear Algebra (MindTap Course List)AlgebraISBN:9781305658004Author:Ron LarsonPublisher:Cengage Learning
 Holt Mcdougal Larson Pre-algebra: Student Edition...AlgebraISBN:9780547587776Author:HOLT MCDOUGALPublisher:HOLT MCDOUGAL