
Videos
Tree Rings and Droughts El Malpais National Monument, in west central New Mexico, has pockets of vegetation that have been surrounded by lava fields for about 3,000 years, so they have escaped wildfires, grazing animals, agricultural activity, and logging. Henri Grissino-Mayer generated a 2,129-year annual precipitation record using tree ring data from living and dead trees in this park (FIGURE 27.23).
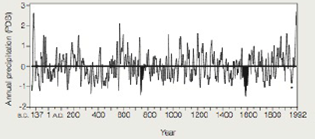
FIGURE 27.23 A 2.129-year annual precipitation record inferred from com pled tree ring data in El Malpais National Monument Now Mexico. Data ware averaged over 10-yeer intervals; graph correlates with other indicators of rainfall collected in all parts of North America. PDSI, Palmer Drought Severity Index: O, normal rainfall increasing numbers mean increasing excess of rainfall decreasing numbers mean increasing severity of drought
* A severe drought contributed to a series of catastrophic dust stem's that turned the rid western United States into a “oust bow” between 1933 and 1939.
1. Around 770 A. D., the Mayan civilization began to suffer a massive population loss, particularly in the southern lowlands of Mesoamerica. The El Malpais tree ring data show a drought during that time. Was it more or less severe than the “dust bowl” drought?
Want to see the full answer?
Check out a sample textbook solution
Chapter 27 Solutions
Biology: The Unity and Diversity of Life (MindTap Course List)


- Tree Rings Reveal Droughts El Malpais National Monument, in west central New Mexico, has pockets of vegetation that have been surrounded by lava fields for about 3,000 years, so they have escaped wildfires, grazing animals, agricultural activity, and logging. Henri Grissino-Mayer generated a 2,129-year annual precipitation record using tree ring data from living and dead trees in this park (FIGURE 27.22). FIGURE 27.22 Annual precipitation record for 2,129 years, inferred from compiled tree ring data in El Malpais National Monument, New Mexico. Data were averaged over 10-year intervals; the graph correlates with other indicators of rainfall collected in all parts of North America. PDSI, Palmer Drought Severity Index: 0, normal rainfall; increasing numbers mean increasing excess of rainfall; decreasing numbers mean increasing severity of drought. A severe drougt contributed to a series of catastrophic dust storms that turned the midwestern United States into a "dust bowl" between 1933 and 1939. One of the worst population catastrophes ever recorded occurred in Mesoamerica between 1519 and a.d. 1600, when around 22 million people native to the region died. Which period between 137 b.c. and 1992 had the most severe drought? How long did that drought last?arrow_forwardAll of the following are reasons why tropical rain forests less likely to grow back as secondary growth forests after widespread deforestation (when compared to temperate forests) EXCEPT: Question 25 options: - All of the above are significant reasons why tropical rain forests may not grow back after widespread deforestation. The soil of tropical rain forests contains much less organic matter and nutrients compared to the soil of temperate forests. - The trees in tropical rain forests are largely responsible for returning water vapor back to the atmosphere through evapotranspiration, so when they are gone, the rains come less frequently. - A larger percentage of the nutrients in a tropical rain forest system are stored in the trees themselves than in temperate forests. - Almost all tropical rain forest species are wind-pollinated, which is less reliable than insect-pollination so tree reproduction is affected more by “chance.”arrow_forwardDeforestation has contributed to erosion and dramatic flooding, particularly in parts of Asia. is this statement true or falsearrow_forward
- If New York experiences drought conditions during April, May, and June 2022, how would you expect local tree rings to differ compared to rings made in 2021 (which had normal rainfall)? Early wood cells would be larger in 2022, creating thicker rings Late wood cells would be larger in 2022, creating thicker rings Early wood cells would be smaller in 2022, creating thinner rings Late wood cells would be smaller in 2022, creating thinner rings Rings would be similar both years as water amount has little effect during spring and early summerarrow_forwardForests of the northeastern and middle Atlantic United States, which have broad-leaf hardwood trees that lose their foliage annually, are called (a) temperate deciduous forests (b) tropical dry forests (c) boreal forests (d) temperate rain forests (e) tropical rain forestsarrow_forwardEnergy Efficiency of Biofuel Production Most of the plant material currently used for biofuel production consists of food cropsmainly corn, soybeans, and sugarcane. In 2006, David Tilman and his colleagues published the results of a 10-year study comparing the net energy output of various biofuels. The researchers grew a mixture of native perennial grasses without irrigation, fertilizer, pesticides, or herbicides, in sandy soil that was so depleted by intensive agriculture that it had been abandoned. They measured the usable energy in biofuels made from the grasses, and also from com and soy, then measured the energy it look to grow and produce biofuel from each kind of crop (Figure 6.1). FIGURE 6.1 Energy input and output of biofuels made from three different crops. One hectare is about 2.5 acres. Which of the three crops would require the least amount of land to produce a given amount of biofuel energy?arrow_forward
- Energy Efficiency of Biofuel Production Most of the plant material currently used for biofuel production consists of food cropsmainly corn, soybeans, and sugarcane. In 2006, David Tilman and his colleagues published the results of a 10-year study comparing the net energy output of various biofuels. The researchers grew a mixture of native perennial grasses without irrigation, fertilizer, pesticides, or herbicides, in sandy soil that was so depleted by intensive agriculture that it had been abandoned. They measured the usable energy in biofuels made from the grasses, and also from com and soy, then measured the energy it look to grow and produce biofuel from each kind of crop (Figure 6.1). FIGURE 6.1 Energy input and output of biofuels made from three different crops. One hectare is about 2.5 acres. Which of the biofuels tested had the highest ratio of energy output to energy input?arrow_forwardEnergy Efficiency of Biofuel Production Most of the plant material currently used for biofuel production in the United States consists of food cropsmainly corn, soybeans, and sugarcane. In 2006, David Tilman and his colleagues published the results of a 10-year study comparing the net energy output of various biofuels. The researchers grew a mixture of native perennial grasses without irrigation, fertilizer, pesticides, or herbicides, in sandy soil that was so depleted by intensive agriculture that it had been abandoned. They measured the usable energy in biofuels made from the grasses, and also from com and soy, then measured the energy it took to grow and produce biofuel from each kind of crop (FIGURE 6.18). FIGURE 6 .18 Energy inputs and outputs of biofuels made from three different crops. One hectare is about 2 .5 acres. 2. Which of the biofuels tested had the highest ratio of energy output to energy input?arrow_forwardEnergy Efficiency of Biofuel Production Most of the plant material currently used for biofuel production in the United States consists of food cropsmainly corn, soybeans, and sugarcane. In 2006, David Tilman and his colleagues published the results of a 10-year study comparing the net energy output of various biofuels. The researchers grew a mixture of native perennial grasses without irrigation, fertilizer, pesticides, or herbicides, in sandy soil that was so depleted by intensive agriculture that it had been abandoned. They measured the usable energy in biofuels made from the grasses, and also from com and soy, then measured the energy it took to grow and produce biofuel from each kind of crop (FIGURE 6.18). FIGURE 6 .18 Energy inputs and outputs of biofuels made from three different crops. One hectare is about 2 .5 acres. 3. Which of the three crops would require the least amount of land to produce a given amount of biofuel energy?arrow_forward
- INTERTRET DATA Scientists have compiled databases of large forest wildfires in the western United States and compared them to climate and land-surface data. Examine the graph showing wildfire frequency compared to average springsummer temperature. Do you see a correlation? If so, describe it. Based on these data, do you think that climate warming is causing more wildfires? Explain your answer.arrow_forwardsupport or refute the following statements based on what you learned about energy flow, biogeochemical cycling, decomposition, trophic levels, and keystone species. You may add a diagram or illustration to support your answer. Planting mangroves is better than putting dolomite sand on the coast of the polluted Manila Bay.arrow_forwardIn which forest biome does the canopy permit low light penetration, and as a result, understory is limited.arrow_forward
 Biology: The Unity and Diversity of Life (MindTap...BiologyISBN:9781305073951Author:Cecie Starr, Ralph Taggart, Christine Evers, Lisa StarrPublisher:Cengage Learning
 Biology: The Unity and Diversity of Life (MindTap...BiologyISBN:9781337408332Author:Cecie Starr, Ralph Taggart, Christine Evers, Lisa StarrPublisher:Cengage Learning
 Biology: The Dynamic Science (MindTap Course List)BiologyISBN:9781305389892Author:Peter J. Russell, Paul E. Hertz, Beverly McMillanPublisher:Cengage Learning
 Biology (MindTap Course List)BiologyISBN:9781337392938Author:Eldra Solomon, Charles Martin, Diana W. Martin, Linda R. BergPublisher:Cengage Learning
 Human Biology (MindTap Course List)BiologyISBN:9781305112100Author:Cecie Starr, Beverly McMillanPublisher:Cengage Learning
 Biology Today and Tomorrow without Physiology (Mi...BiologyISBN:9781305117396Author:Cecie Starr, Christine Evers, Lisa StarrPublisher:Cengage Learning