
Concept explainers
Videos
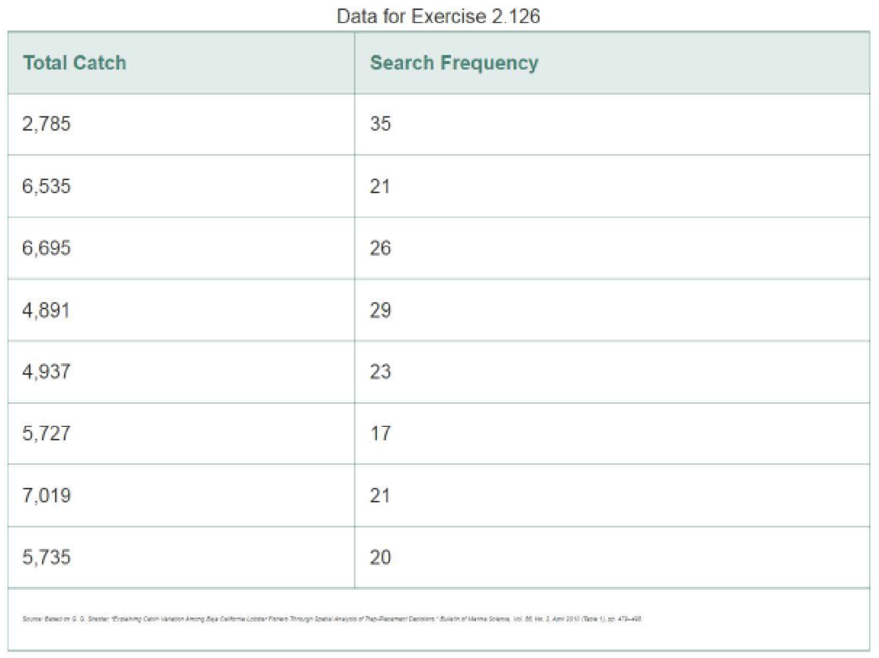
Lobster trap placement. Strategic placement of lobster traps is one of the keys for a successful lobster fisherman. An observational study of teams fishing for the red spiny lobster in Baja California Sur, Mexico, was conducted and the results published in Bulletin of Marine Science (April 2010). Two variables measured for each of eight teams from the Punta Abreojos (PA) fishing cooperative were y = total catch of lobsters (in kilograms) during the season and x = average percentage of traps allocated per day to exploring areas of unknown catch (called search frequency). These data are listed in the next table. Graph the data in a
Want to see the full answer?
Check out a sample textbook solution
Chapter 2 Solutions
Statistics For Business And Economics, University Of Connecticut


- Occupational prestige scores for a sample of fathers and their oldest son and oldest daughter are presented in the following tables. Analyze the relationship between father’s and son’s prestige, and the relationship between father’s and daughter’s prestige. Compute r and r Describe the strength and the direction of the relationship in a sentence or two. Does Occupational prestige of the father have an impact on his children. Does it have the same impact for his daughters as it does for sons?(Please ensure that you utilize the five-step model and show all your work when addressing the question) Family Father’s Prestige Son’s Prestige Daughter’s Prestige A 80 85 82 B 78 80 77 C 75 70 68 D 70 75 77 E 69 72 60 F 66 60 52 G 64 48 48 H 52 55 57arrow_forwardRecent research indicates that the effectiveness of antidepressant medication is directly related to the severity of the depression (Khan, Brodhead, Kolts & Brown, 2005). Based on pretreatment depression scores, patients were divided into four groups based on their level of depression. After receiving the antidepressant medication, depression scores were measured again and the amount of improvement was recorded for each patient. The following data are similar to the results of the study. LowModerate HighModerate ModeratelySevere Severe 2.2 1.4 3.4 3.4 1.5 1.4 3.5 2.8 2.8 3.1 2.7 2.3 1.7 2.6 4.4 3.6 1.3 1.5 2.6 3.2 1.3 2.6 2.8 3.5 Fill in the summary table for the ANOVA test: degrees of freedom (d.f.) Sum of Squares (S.S.) Mean Square (M.S.) Between Within Total From this table, obtain the necessary statistics for the ANOVA:F-ratio (F-test statistic): p-value: η2η2 (Eta squared = Sum of squares betweenSum of squares totalSum…arrow_forwardRecent research indicates that the effectiveness of antidepressant medication is directly related to the severity of the depression (Khan, Brodhead, Kolts & Brown, 2005). Based on pretreatment depression scores, patients were divided into four groups based on their level of depression. After receiving the antidepressant medication, depression scores were measured again and the amount of improvement was recorded for each patient. The following data are similar to the results of the study. LowModerate HighModerate ModeratelySevere Severe 2.4 0.2 2.5 3.5 1.6 1.7 2.7 4.3 2.7 3.4 2 3.4 0.5 1.2 5.2 5.1 2.4 2.3 4 3.5 1.8 0.3 4.1 3.8 From this table, conduct an one-way ANOVA. Calculate the F-ratio and p-value. Be sure to round your answers to three decimal places. Assume all population and ANOVA requirements are met.F-ratio: _____p-value: _____What is your final conclusion? Use a significance level of α=0.05. (Select one): There is sufficient evidence that…arrow_forward
- Recent research indicates that the effectiveness of antidepressant medication is directly related to the severity of the depression (Khan, Brodhead, Kolts & Brown, 2005). Based on pretreatment depression scores, patients were divided into four groups based on their level of depression. After receiving the antidepressant medication, depression scores were measured again and the amount of improvement was recorded for each patient. The following data are similar to the results of the study. LowModerate HighModerate ModeratelySevere Severe 0.5 2.7 3.4 2.6 1.7 0.8 2.6 5.3 3.3 1.9 1.1 4 2.6 1.4 4.3 2.6 1.4 2.9 3.6 4.6 3.1 3.2 4.8 1.4 From this table, conduct an one-way ANOVA. Calculate the F-ratio and p-value. Be sure to round your answers to three decimal places. Assume all population and ANOVA requirements are met.F-ratio: p-value:arrow_forwardRecent research indicates that the effectiveness of antidepressant medication is directly related to the severity of the depression (Khan, Brodhead, Kolts & Brown, 2005). Based on pretreatment depression scores, patients were divided into four groups based on their level of depression. After receiving the antidepressant medication, depression scores were measured again and the amount of improvement was recorded for each patient. The following data are similar to the results of the study. LowModerate HighModerate ModeratelySevere Severe 0.3 1.2 2.2 1.8 3.8 1.7 1.4 2.8 3.2 0.4 0.6 2.6 2.3 1.2 1.6 2.6 2 3.2 1.6 2.2 0.6 1.2 1.6 1 2.7 1 2.2 0.6 1.4 1.6 3.3 2.7 2.2 2.9 3.7 2.6 0.9 0.7 3.4 3.1 2.6 1.7 0.8 1.8 2 1.4 1.6 4.1 1.7 0.9 3.3 2.3 1.6 1.1 3.5 1.4 3.5 1.9 0.4 4.2 1.5 2.3 2.2 2.9 1.4 2.2 2.7 2.8 2.1 1.9 1.9 3.9 1.5 2.7 0.8 1.5 1 3 2.1 3.7 1.5 0.9 2.4 1.9 2.7 3.2 0.8 2.7 2.2 2.9 1.8 1.2 2.4 1.7 3.2 1.3 2.2 2.4 1.1 1 2.6 2…arrow_forward
 Glencoe Algebra 1, Student Edition, 9780079039897...AlgebraISBN:9780079039897Author:CarterPublisher:McGraw Hill
 Big Ideas Math A Bridge To Success Algebra 1: Stu...AlgebraISBN:9781680331141Author:HOUGHTON MIFFLIN HARCOURTPublisher:Houghton Mifflin Harcourt