Videos
(a)
To find: The people who are selected for the simple random sample.
(a)
Answer to Problem 12E
Solution: The selected people are those who are labeled as 19, 22, 39, and 50.
Explanation of Solution
Calculation:
The people are labeled as
The people selected are the people who are numbered with the same number of the selected random numbers.
To find: The proportion,
Answer to Problem 12E
Solution: The required proportion is obtained as 0.5.
Explanation of Solution
Calculation:
According to the question, the colored circle indicates the persons who are opposing the constitutional amendment and the white circle represents the people who are in favor of the amendment. The selected persons are 19, 22, 39, and 50. Among them, 19 and 50 are the colored circles and 22 and 39 are the white circles.
Therefore, the proportion
(b)
To find: The people who are selected for the simple random sample.
(b)
Answer to Problem 12E
Solution: The selected people are those people who are labeled with the same number of selected random number and the samples are shown in the below table.
| Sample | Selected label |
| Sample 1 | 45, 46, 77, 17 |
| Sample 2 | 52, 71, 13, 88 |
| Sample 3 | 95, 59, 29, 40 |
| Sample 4 | 68, 41, 73, 50 |
| Sample 5 | 82, 73, 95, 78 |
| Sample 6 | 60, 94, 07, 20 |
| Sample 7 | 36, 00, 91, 93 |
| Sample 8 | 38, 44,84, 87 |
| Sample 9 | 73, 67, 64, 71 |
Explanation of Solution
Calculation:
The people are labeled as
The people selected are the people who are numbered with the same number of the selected random numbers.
Similarly, the other eight samples of size 4 are selected and the samples are shown in the below table.
| Sample | Selected label |
| Sample 1 | 45, 46, 77, 17 |
| Sample 2 | 52, 71, 13, 88 |
| Sample 3 | 95, 59, 29, 40 |
| Sample 4 | 68, 41, 73, 50 |
| Sample 5 | 82, 73, 95, 78 |
| Sample 6 | 60, 94, 07, 20 |
| Sample 7 | 36, 00, 91, 93 |
| Sample 8 | 38, 44, 84, 87 |
Here, the people selected in each set of sample are the people who are numbered with the same number of the selected random numbers.
To find: The proportion,
Answer to Problem 12E
Solution: The required proportions for the 10 samples are shown below.
| Sample | Labeled value | Proportion |
| Sample 1 | 45, 46, 77, 17 | 0.75 |
| Sample 2 | 52, 71, 13, 88 | 1 |
| Sample 3 | 95, 59, 29, 40 | 0.75 |
| Sample 4 | 68, 41, 73, 50 | 0.5 |
| Sample 5 | 82, 73, 95, 78 | 0.75 |
| Sample 6 | 60, 94, 07, 20 | 0 |
| Sample 7 | 36, 00, 91, 93 | 0.75 |
| Sample 8 | 38, 44,84, 87 | 0.5 |
| Sample 9 | 73, 67, 64, 71 | 0.5 |
| Sample 10 | 19, 22, 39, 50 | 0.5 |
Explanation of Solution
Calculation:
The calculation of the sample proportion,
| Sample | Labeled value | Colored circle | White circle | Proportion |
| Sample 1 | 45, 46, 77, 17 | 77 | 45, 46, 17 | |
| Sample 2 | 52, 71, 13, 88 | 88 | 52, 71, 13 | |
| Sample 3 | 95, 59, 29, 40 | 29, 40, 95, 59 | ||
| Sample 4 | 68, 41, 73, 50 | 73, 50 | 68, 41 | |
| Sample 5 | 82, 73, 95, 78 | 73, | 82, 95, 78 | |
| Sample 6 | 60, 94, 07, 20 | 60, 94, 07, 20 | ||
| Sample 7 | 36, 00, 91, 93 | 91 | 00, 36, 93 | |
| Sample 8 | 38, 44,84, 87 | 38, 87 | 44, 84 | |
| Sample 9 | 73, 67, 64, 71 | 73, 64 | 67, 71 | |
| Sample 10 | 19, 22, 39, 50 | 22, 39 | 19, 50 |
(c)
To graph: The histogram.
(c)
Answer to Problem 12E
Solution: The required histogram is shown below.
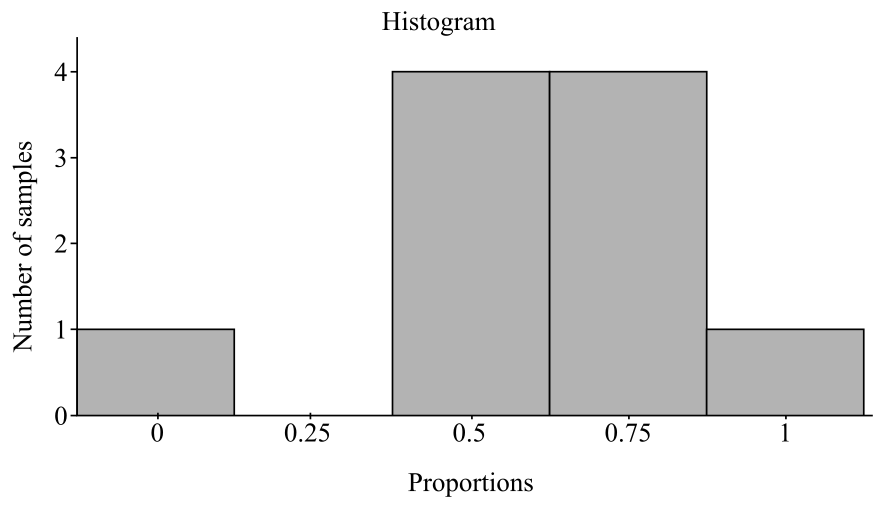
Explanation of Solution

Interpretation: From the hisogram it is clear that none of the sample has sample proportion of 0.25.
(d)
The number of sample proportion that estimates the population proportion as p = 0.5
(d)
Answer to Problem 12E
Solution: There are 4 samples that provide the proportion as 0.5.
Explanation of Solution
Whether the value 0.5 is in the center of the sample values.
Answer to Problem 12E
Solution: The original value 0.5 is in the center for the sample proportion values.
Explanation of Solution
To explain: The reason that the population proportion value will be in the center for the large samples.
Answer to Problem 12E
Solution: The value will be centered in 0.5 for large samples because the large samples have less variability than the small samples.
Explanation of Solution
Want to see more full solutions like this?
Chapter 3 Solutions
Loose-leaf Version for Statistics: Concepts and Controversies


 MATLAB: An Introduction with ApplicationsStatisticsISBN:9781119256830Author:Amos GilatPublisher:John Wiley & Sons Inc
 Probability and Statistics for Engineering and th...StatisticsISBN:9781305251809Author:Jay L. DevorePublisher:Cengage Learning
 Statistics for The Behavioral Sciences (MindTap C...StatisticsISBN:9781305504912Author:Frederick J Gravetter, Larry B. WallnauPublisher:Cengage Learning
 Elementary Statistics: Picturing the World (7th E...StatisticsISBN:9780134683416Author:Ron Larson, Betsy FarberPublisher:PEARSON
 The Basic Practice of StatisticsStatisticsISBN:9781319042578Author:David S. Moore, William I. Notz, Michael A. FlignerPublisher:W. H. Freeman
 Introduction to the Practice of StatisticsStatisticsISBN:9781319013387Author:David S. Moore, George P. McCabe, Bruce A. CraigPublisher:W. H. Freeman