
Concept explainers
Videos
a.
Describe the graph represents each type of investment .
a.
Answer to Problem 12PS
The linear graph represents the graph for simple interest and exponential graph represents for compound interest.
Explanation of Solution
Calculation:
We have two options for investing
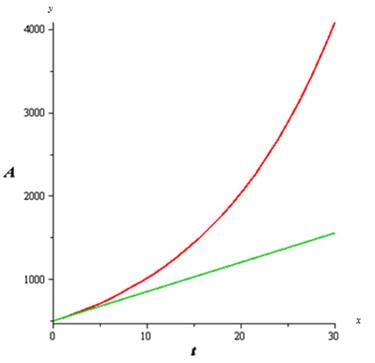
As we know the future amount increases exponentially for the compound interest and linearly for the simple interest.
Hence, the linear graph represents the graph for simple interest and exponential graph represents for compound interest.
b.
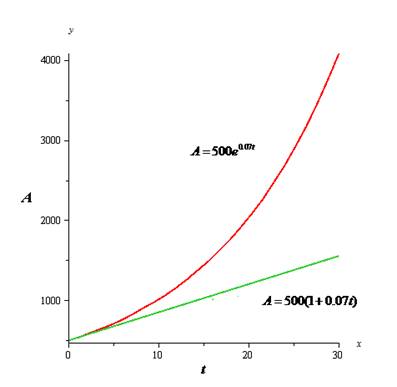
Find the equations that model the investment growth and by graphing the models.
b.
Answer to Problem 12PS
Explanation of Solution
Calculation:
We know the formula for future amount with compound interest,
We know the formula for future amount with simple interest,
Now, plotting the graph,

Hence, the graph is shown above.
c.
Choose the option.
c.
Answer to Problem 12PS
Compound interest.
Explanation of Solution
Calculation:
We would choose the compound interest because the interest for that one increases rapidly than the simple interest.
Hence, we would have chosen compound interest.
Chapter 3 Solutions
EBK PRECALCULUS W/LIMITS


 Calculus: Early TranscendentalsCalculusISBN:9781285741550Author:James StewartPublisher:Cengage Learning
 Thomas' Calculus (14th Edition)CalculusISBN:9780134438986Author:Joel R. Hass, Christopher E. Heil, Maurice D. WeirPublisher:PEARSON
 Calculus: Early Transcendentals (3rd Edition)CalculusISBN:9780134763644Author:William L. Briggs, Lyle Cochran, Bernard Gillett, Eric SchulzPublisher:PEARSON
 Calculus: Early TranscendentalsCalculusISBN:9781319050740Author:Jon Rogawski, Colin Adams, Robert FranzosaPublisher:W. H. Freeman
 Calculus: Early Transcendental FunctionsCalculusISBN:9781337552516Author:Ron Larson, Bruce H. EdwardsPublisher:Cengage Learning